Ursa - ClickHouse Research Fork
Overview
During the New Year holidays at the end of December 2024, I decided to fork ClickHouse to improve its performance and implement some ideas I had for a while. The main thing was to beat Umbra in the ClickBench benchmark or at least come close to its performance. In the process, I learned a lot of new stuff, found a lot of places for performance improvements in ClickHouse, and implemented some interesting features.
I named my research fork Ursa. In this blog post, I want to describe what tooling was used during development, optimizations that were implemented, optimizations that did not work, and potential future Ursa/ClickHouse improvements.
Motivation
The goal was to research all possible ClickHouse optimizations, even if they are backward incompatible with the original ClickHouse codebase. If some of them are useful and provide a lot of performance improvements, they can be backported to ClickHouse while keeping backward compatibility.
Additionally, I was short on time and had around 2 holiday weeks for development, so I wanted to implement optimizations in order of importance. I tried to measure potential performance improvement from some features before actual development to understand if it was worth it. To measure every performance improvement during development, I developed a paw tool that I ran for all queries in ClickBench countless times and analyzed both on-CPU and off-CPU flame graphs for every query before and after different optimizations.
As a result, at the end of 2024, I had the first implementation of Ursa 0.0.1. At that time, when I benchmarked it for ClickBench, Ursa was in the top 2 databases in a hot run and the top 1 in a cold run for the default ClickBench c6a.4xlarge machine.
I was able to polish some features/fix bugs in my spare time, and in March, I pushed results to ClickBench. I also wanted to implement a couple more complex improvements but have not been able to do them yet. Meanwhile, there were huge improvements and changes in ClickBench from DuckDB, Salesforce Hyper, and Oxla. So Ursa became top 2 in a cold run and top 4 in a hot run.
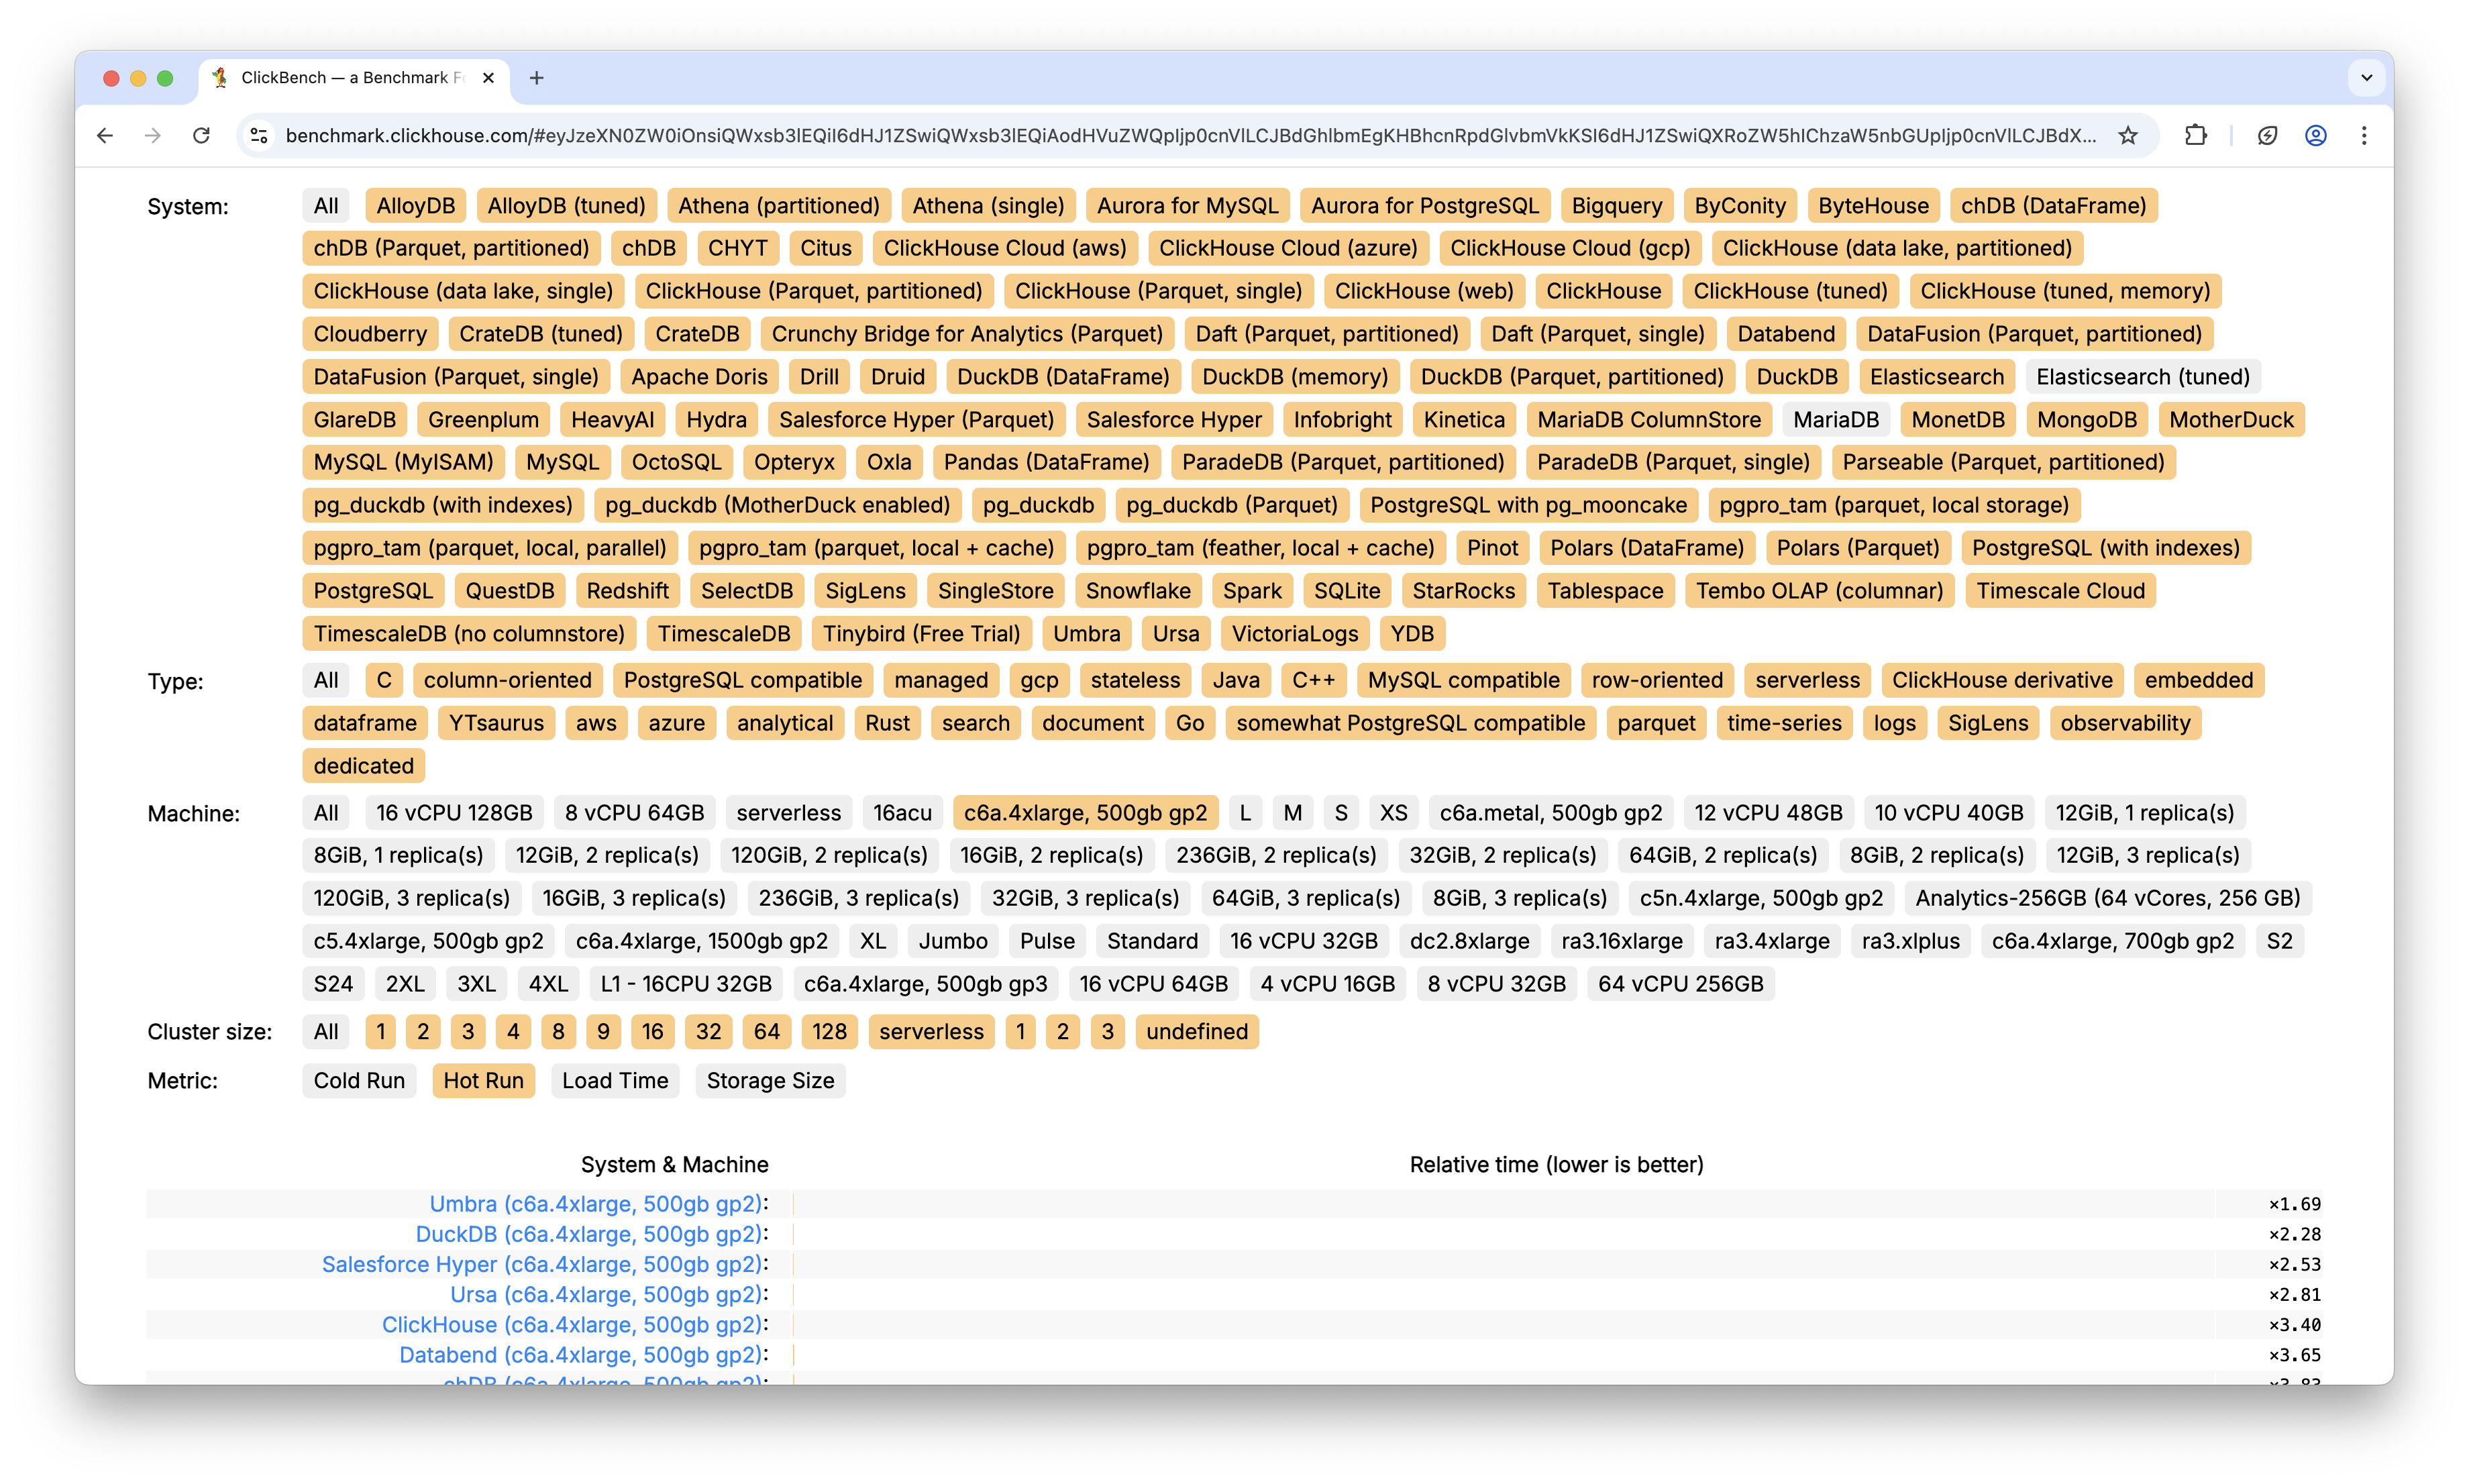
By default, all tests in ClickBench are run on c6a.4xlarge VM in AWS with 500 GB gp2 disk. Here is the current state of ClickBench as of April 15 2025, using the c6a.4xlarge virtual machine.
Here is cold run:

Here is hot run:
Paw
Before going into details of optimizations, I wanted to describe what tooling I used during the development of Ursa. I will show a simple example of paw tool usage and my typical workflow.
Config config.yaml. By default, config is not required, I just wanted to show what it looks like and what things you can configure:
profiles:
  - name: clickhouse
    driver: clickhouse
    settings:
      host: 127.0.0.1
      port: 9000
  - name: clickhouse_scatter_aggregation
    driver: clickhouse
    settings:
      host: 127.0.0.1
      port: 9000
      force_scatter_aggregation: 1
  - name: clickhouse_aggregation_scatter_copy_chunks
    driver: clickhouse
    settings:
      host: 127.0.0.1
      port: 9000
      aggregation_scatter_based_on_statistics: 1
      aggregation_default_scatter_algorithm: copy_chunks
  - name: clickhouse_aggregation_scatter_indexes_info
    driver: clickhouse
    settings:
      host: 127.0.0.1
      port: 9000
      aggregation_scatter_based_on_statistics: 1
      aggregation_default_scatter_algorithm: indexes_info
collector_profiles:
  - name: cpu_flamegraph
    collector: cpu_flamegraph
    settings:
      build_seconds: 5
  - name: off_cpu_flamegraph
    collector: off_cpu_flamegraph
    settings:
      build_seconds: 5
settings:
  query_measure_runs: 5
Test clickbench.yaml:
name: ClickBench
collectors:
  - cpu_flamegraph
queries:
  - SELECT COUNT(*) FROM hits;
  - SELECT COUNT(*) FROM hits WHERE AdvEngineID <> 0;
  - SELECT SUM(AdvEngineID), COUNT(*), AVG(ResolutionWidth) FROM hits;
  - SELECT AVG(UserID) FROM hits;
  - SELECT COUNT(DISTINCT UserID) FROM hits;
  - SELECT COUNT(DISTINCT SearchPhrase) FROM hits;

  ...

  - SELECT DATE_TRUNC('minute', EventTime) AS M, COUNT(*) AS PageViews FROM hits ...
Then you can run paw with:
./paw record -c config.yaml clickbench.yaml -o clickhouse_dev_clickbench_cpu_only
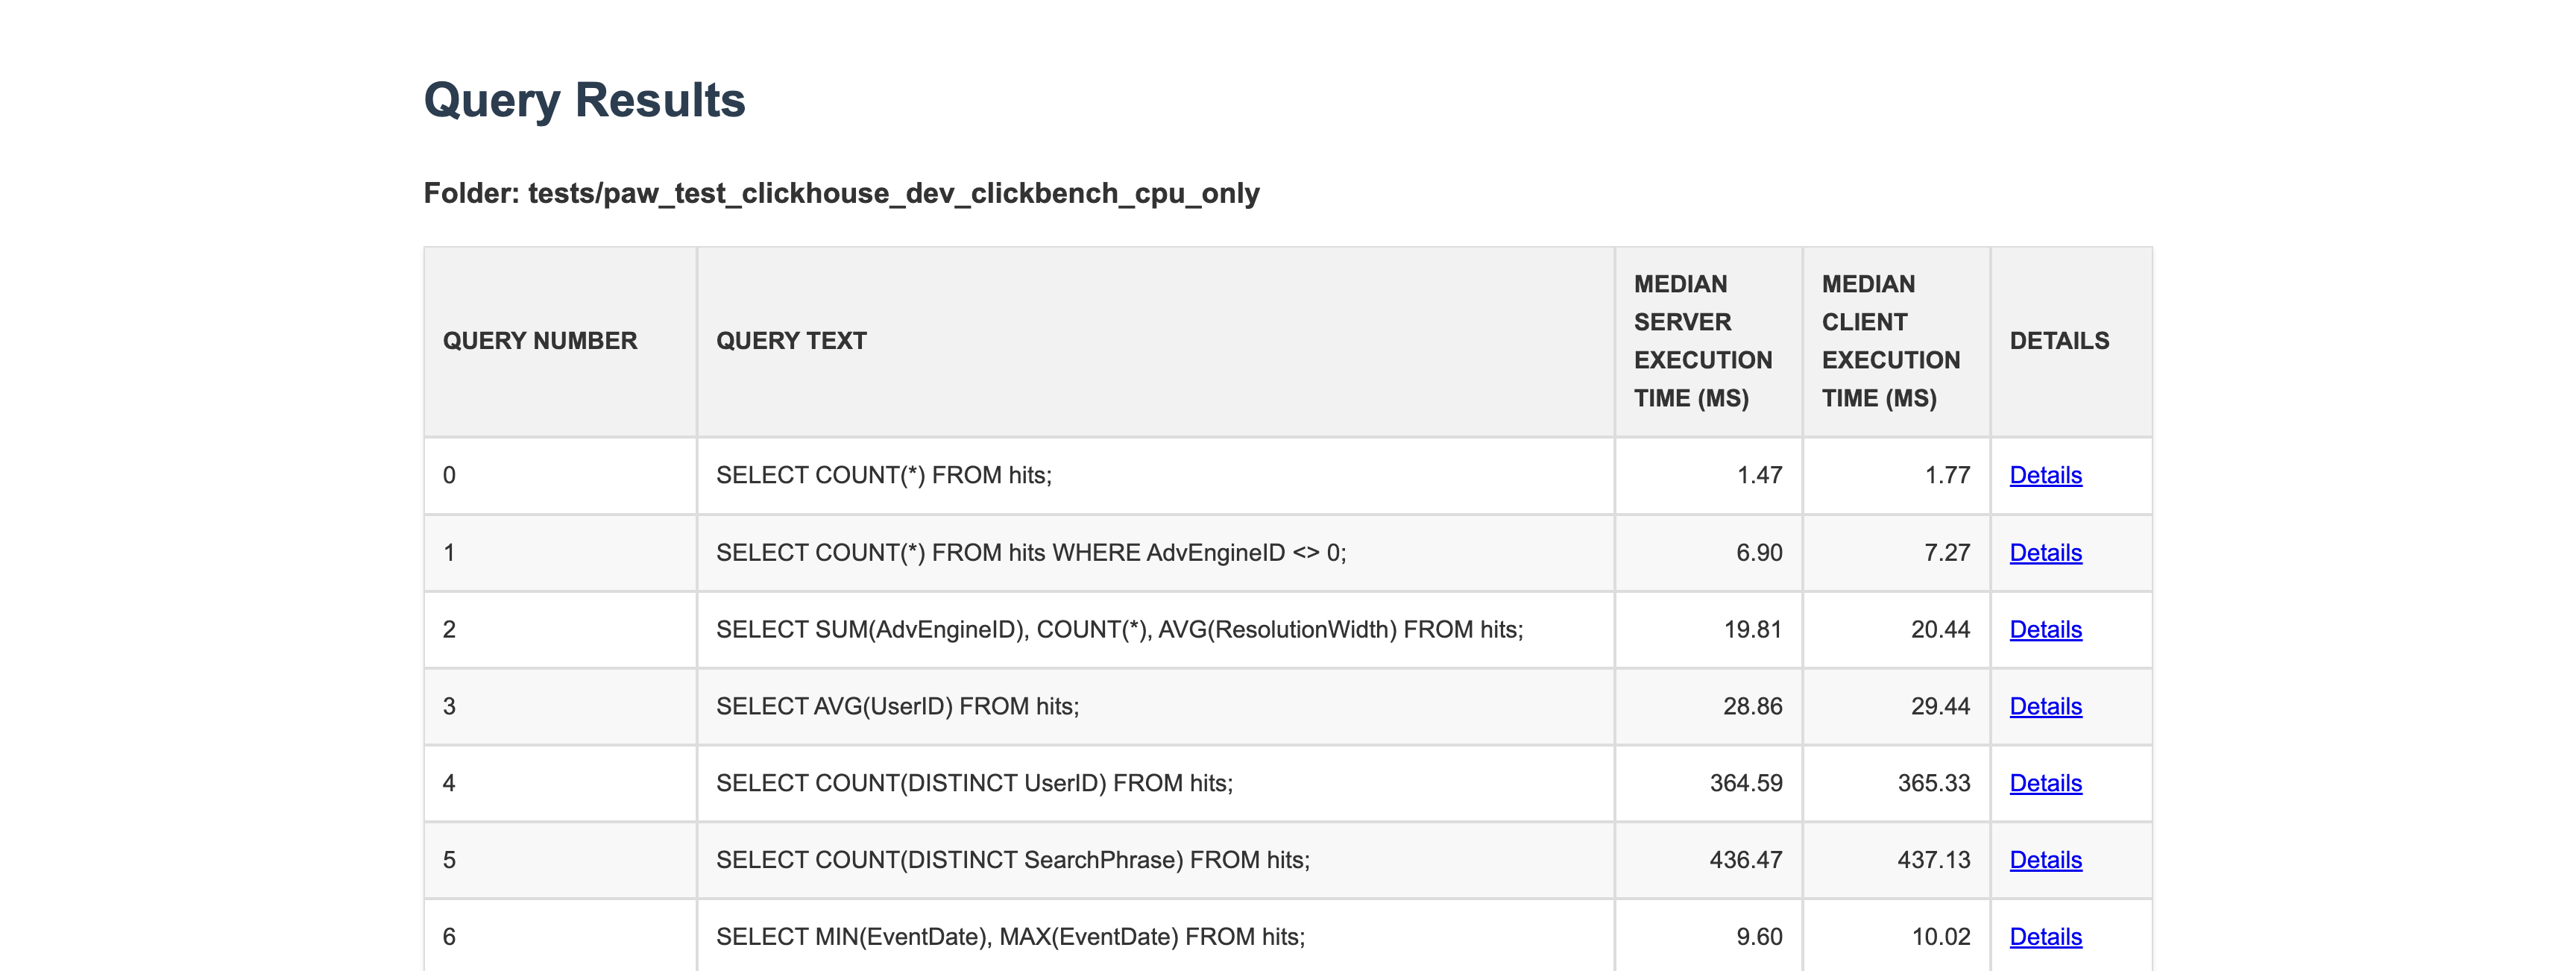
Then you can check results in clickhouse_dev_clickbench_cpu_only directory using web viewer:
./paw view clickhouse_dev_clickbench_cpu_only
Queries in single test result:
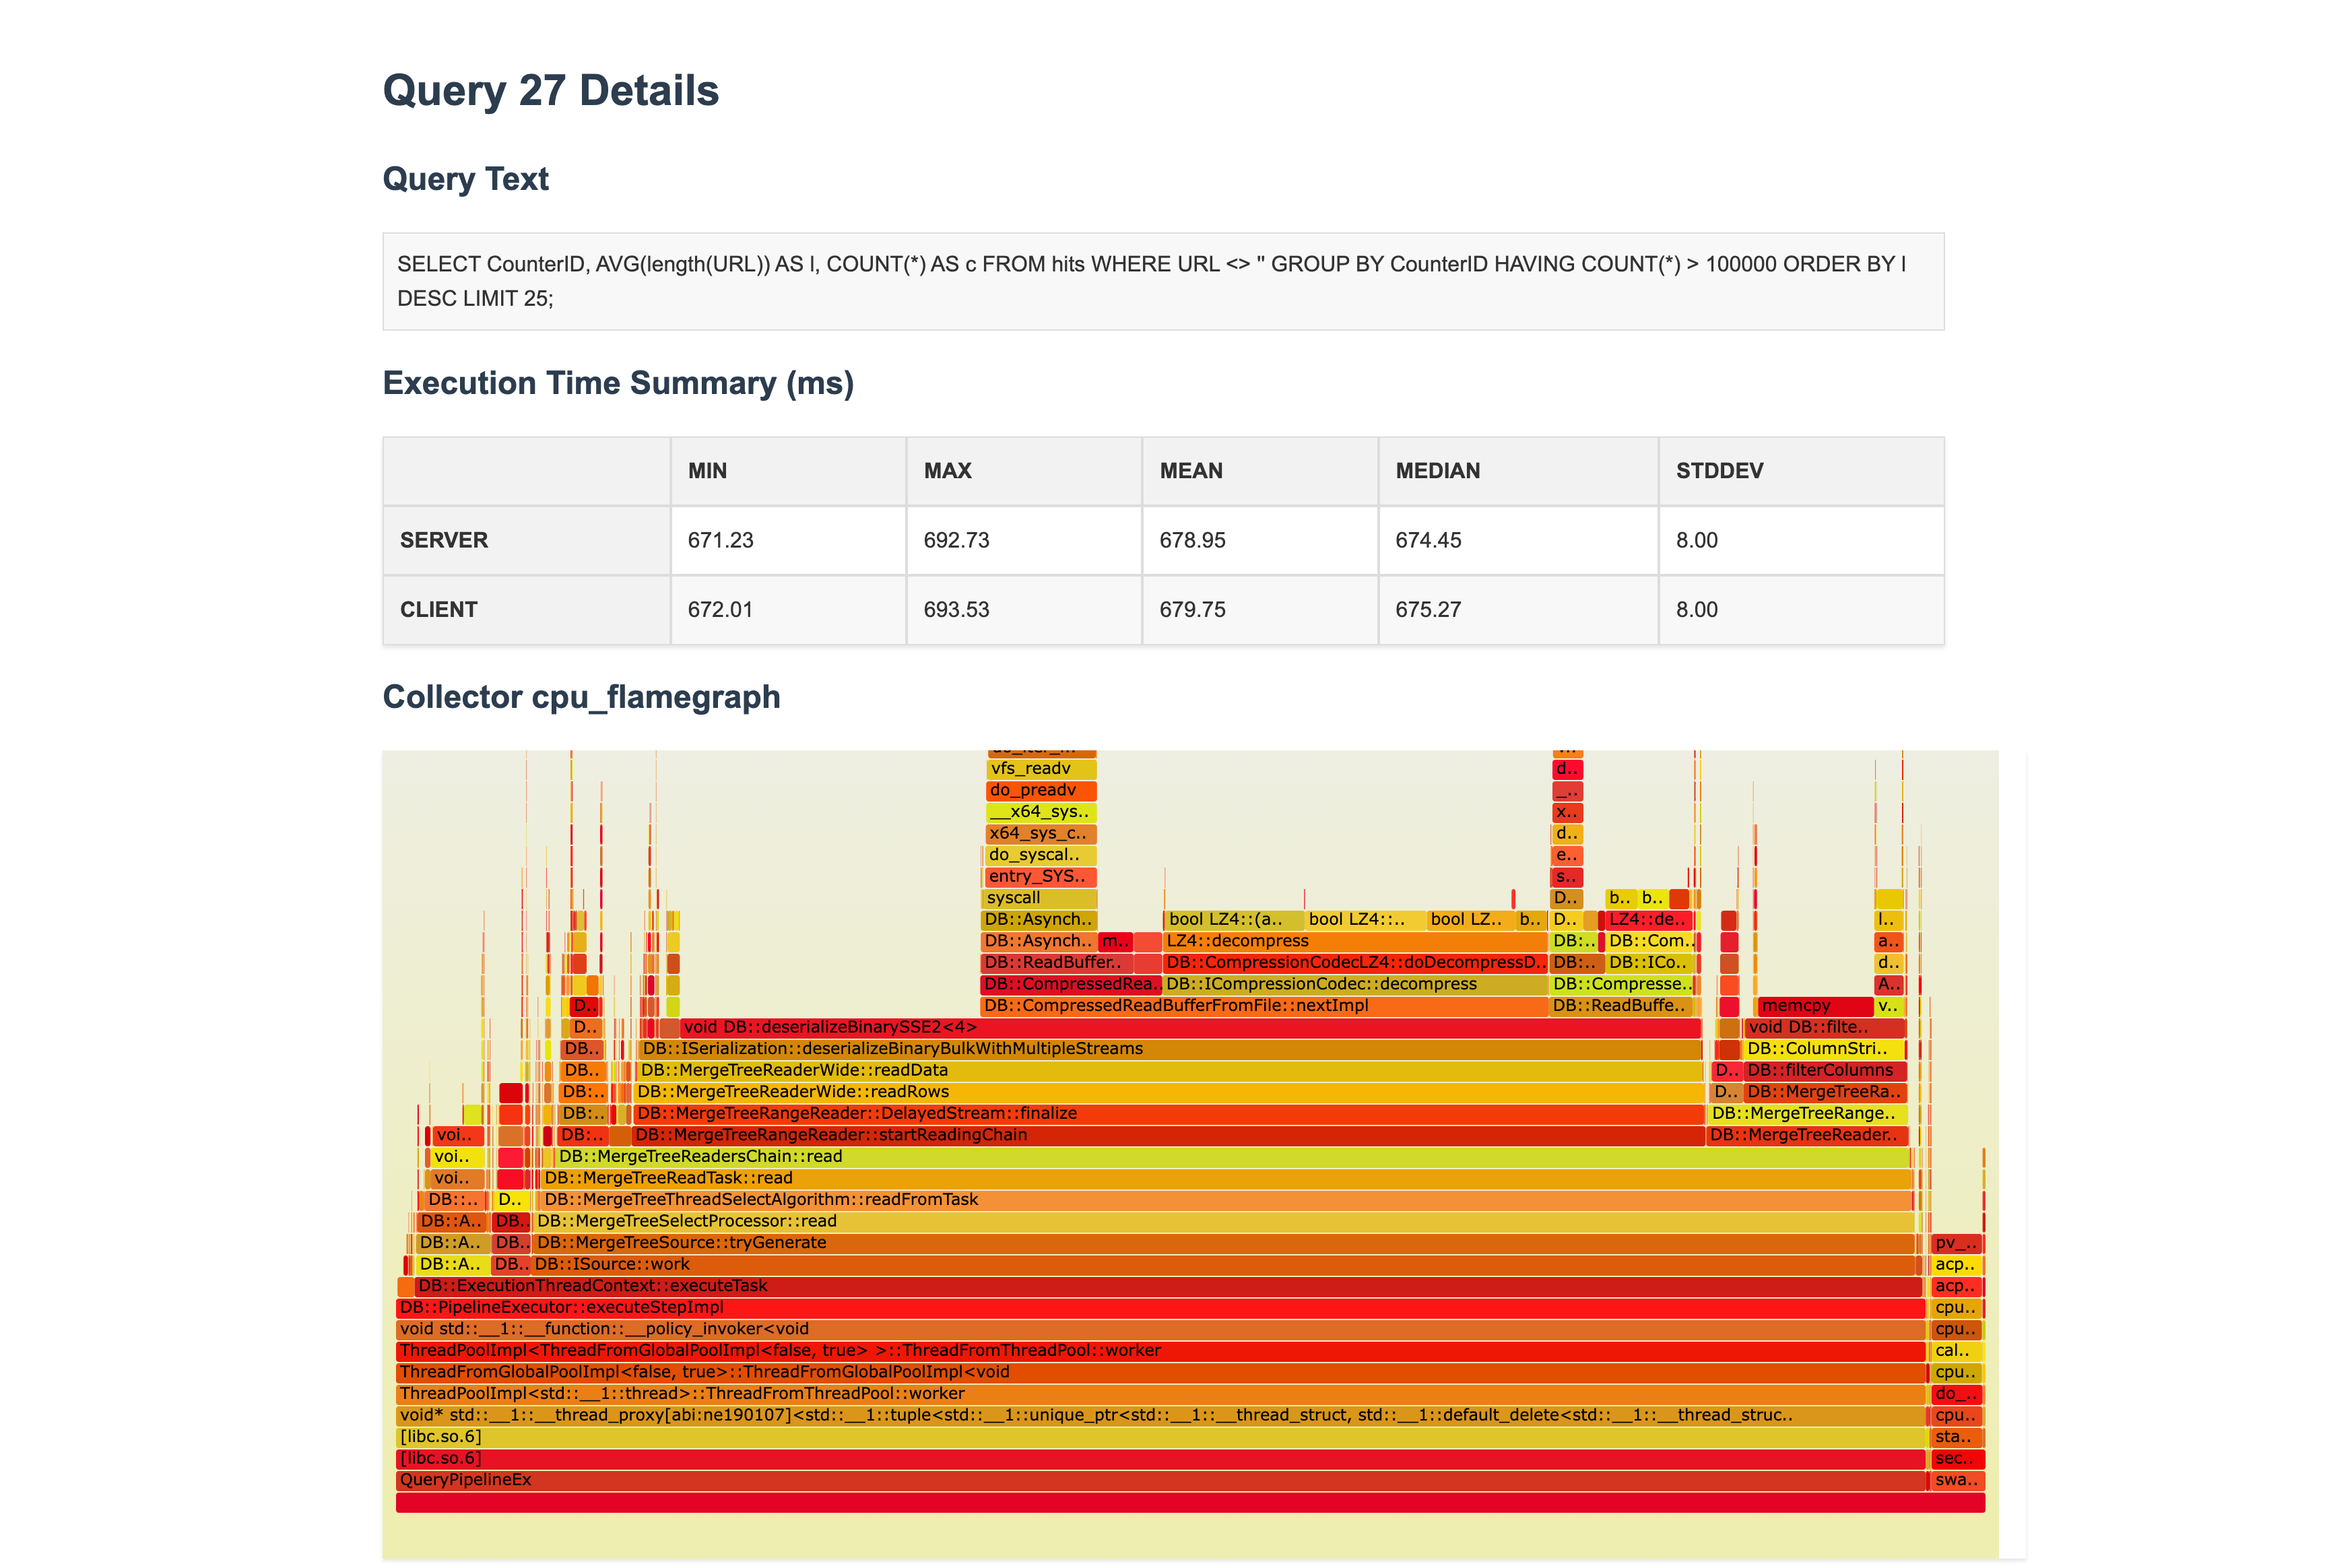
Query details in single test result:
Then, when you find a place for performance improvement and implement optimization in ClickHouse, you can rerun the test and recheck the results:
./paw record -c config.yaml clickbench_cpu_only.yaml -o ursa_clickbench_cpu_only
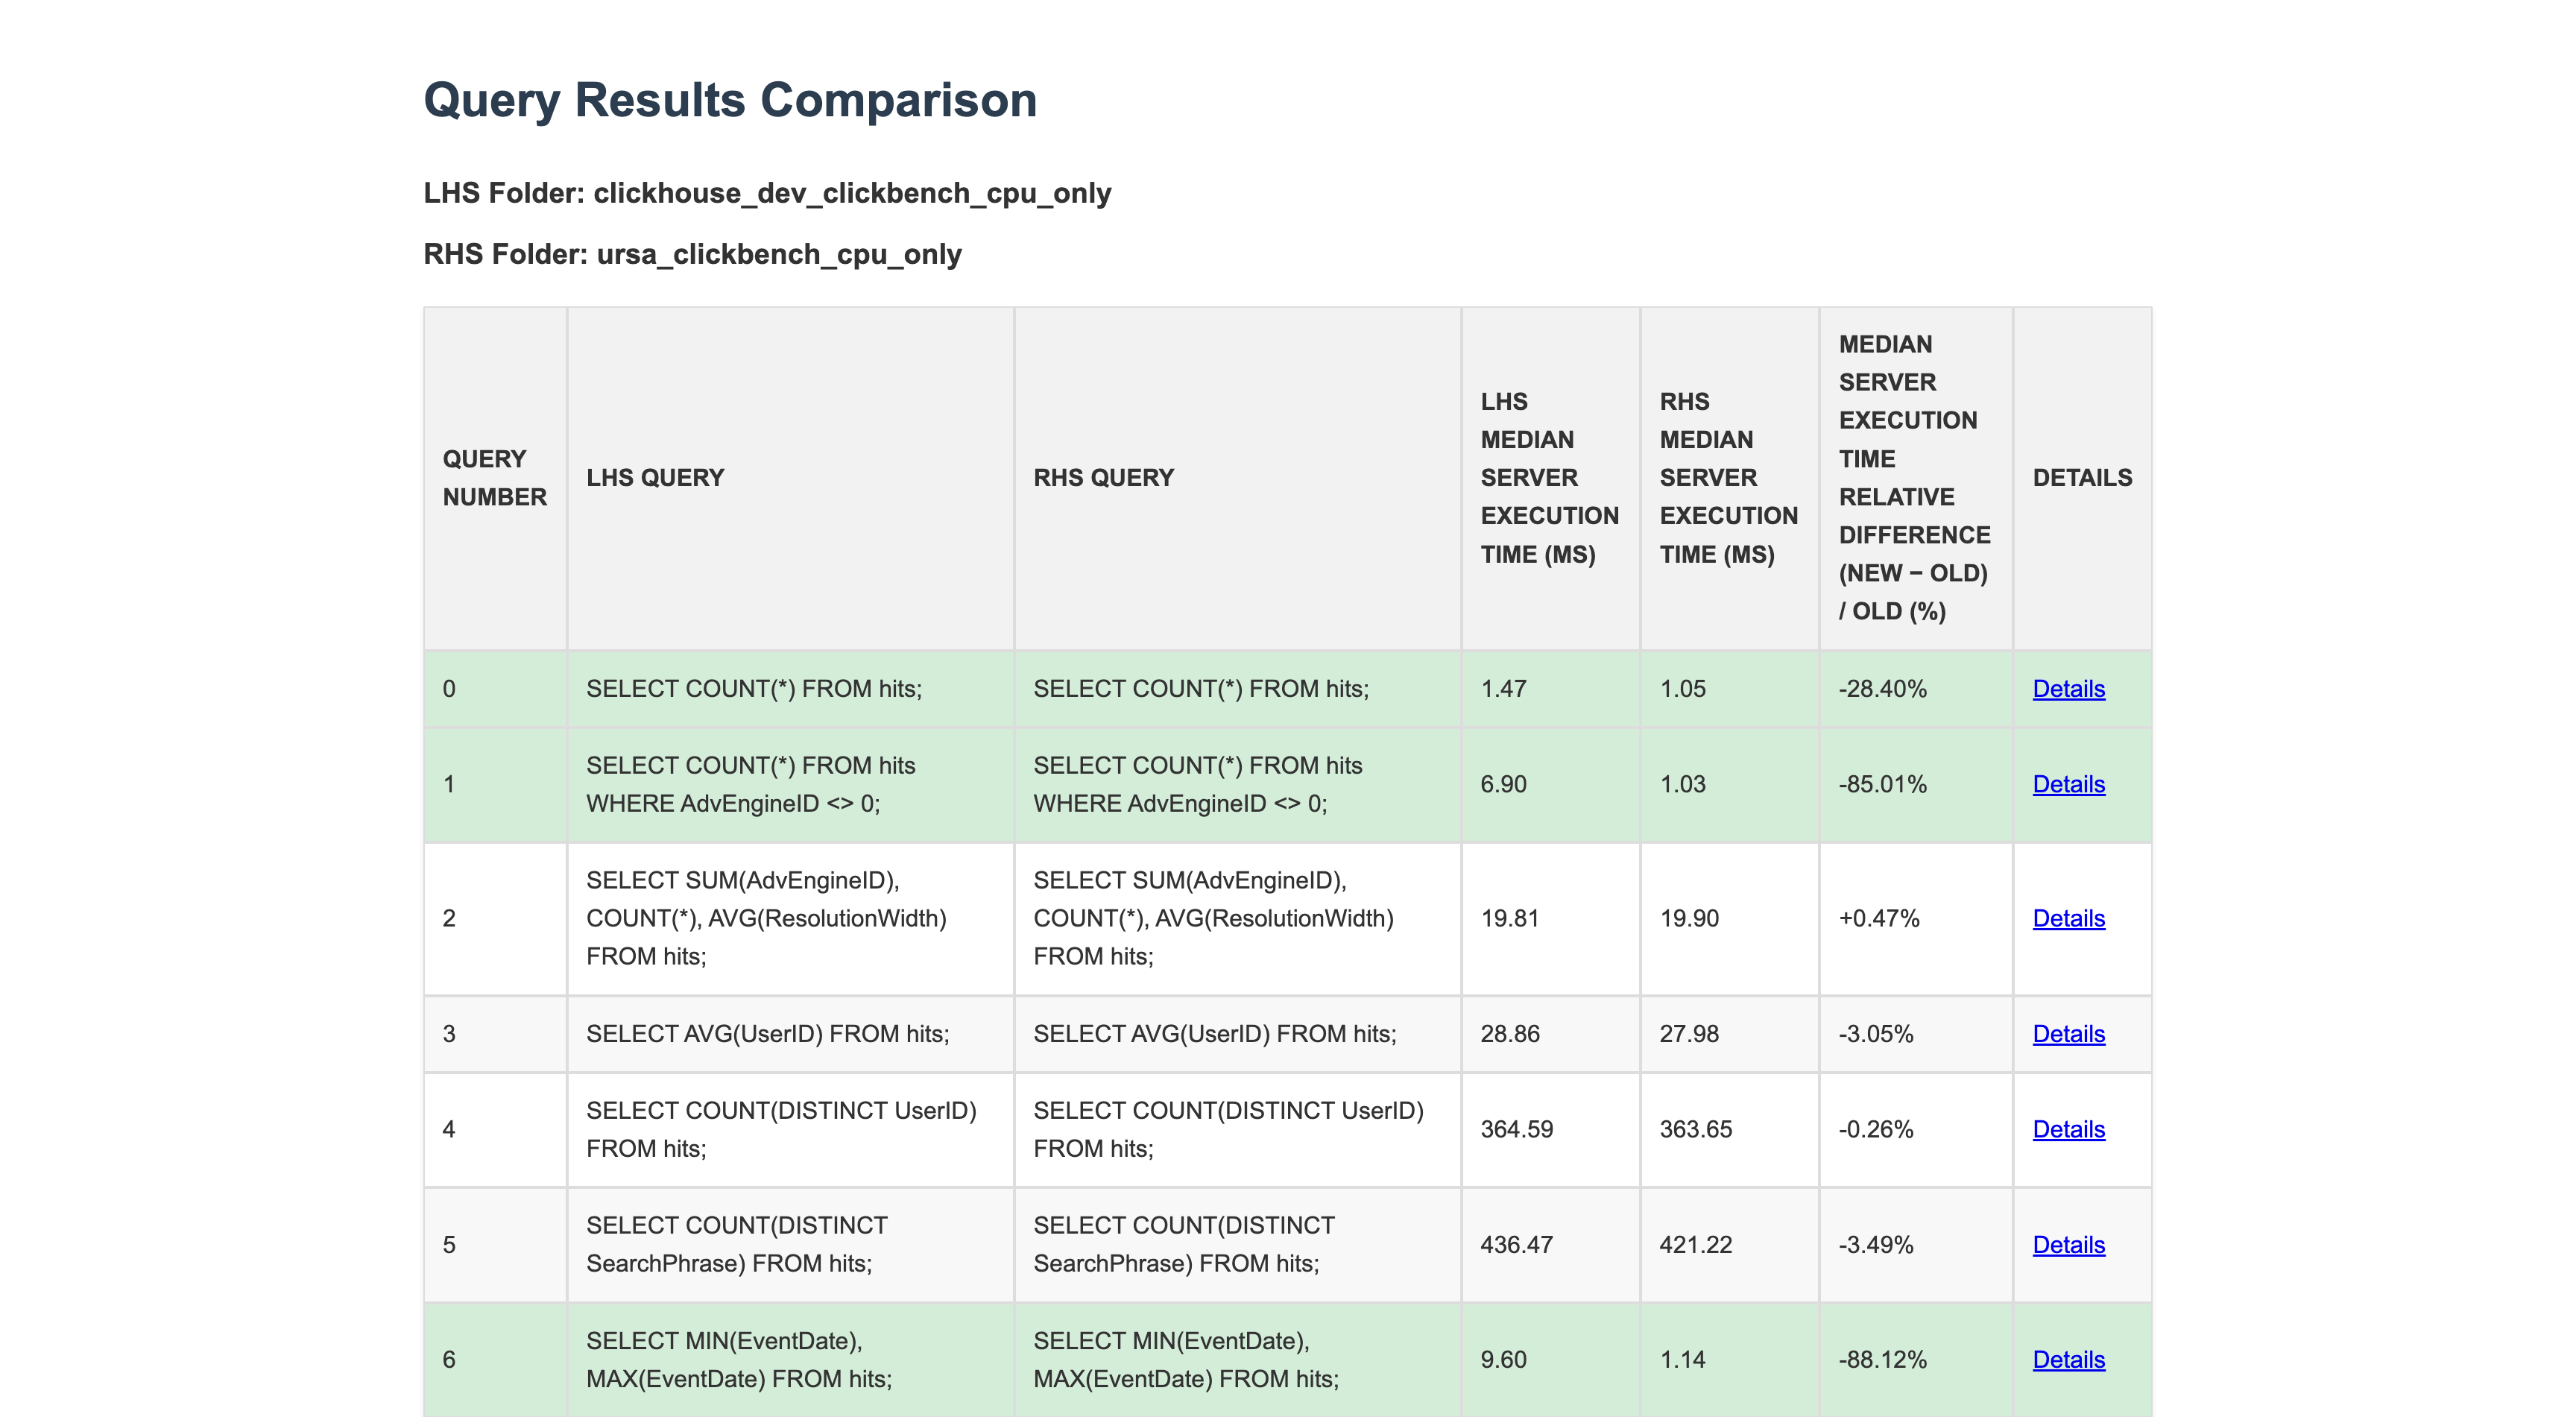
Now you can compare two test results using web viewer:
./paw view clickhouse_dev_clickbench_cpu_only ursa_clickbench_cpu_only
Queries in difference between two test results:
Query details in difference between two test results:
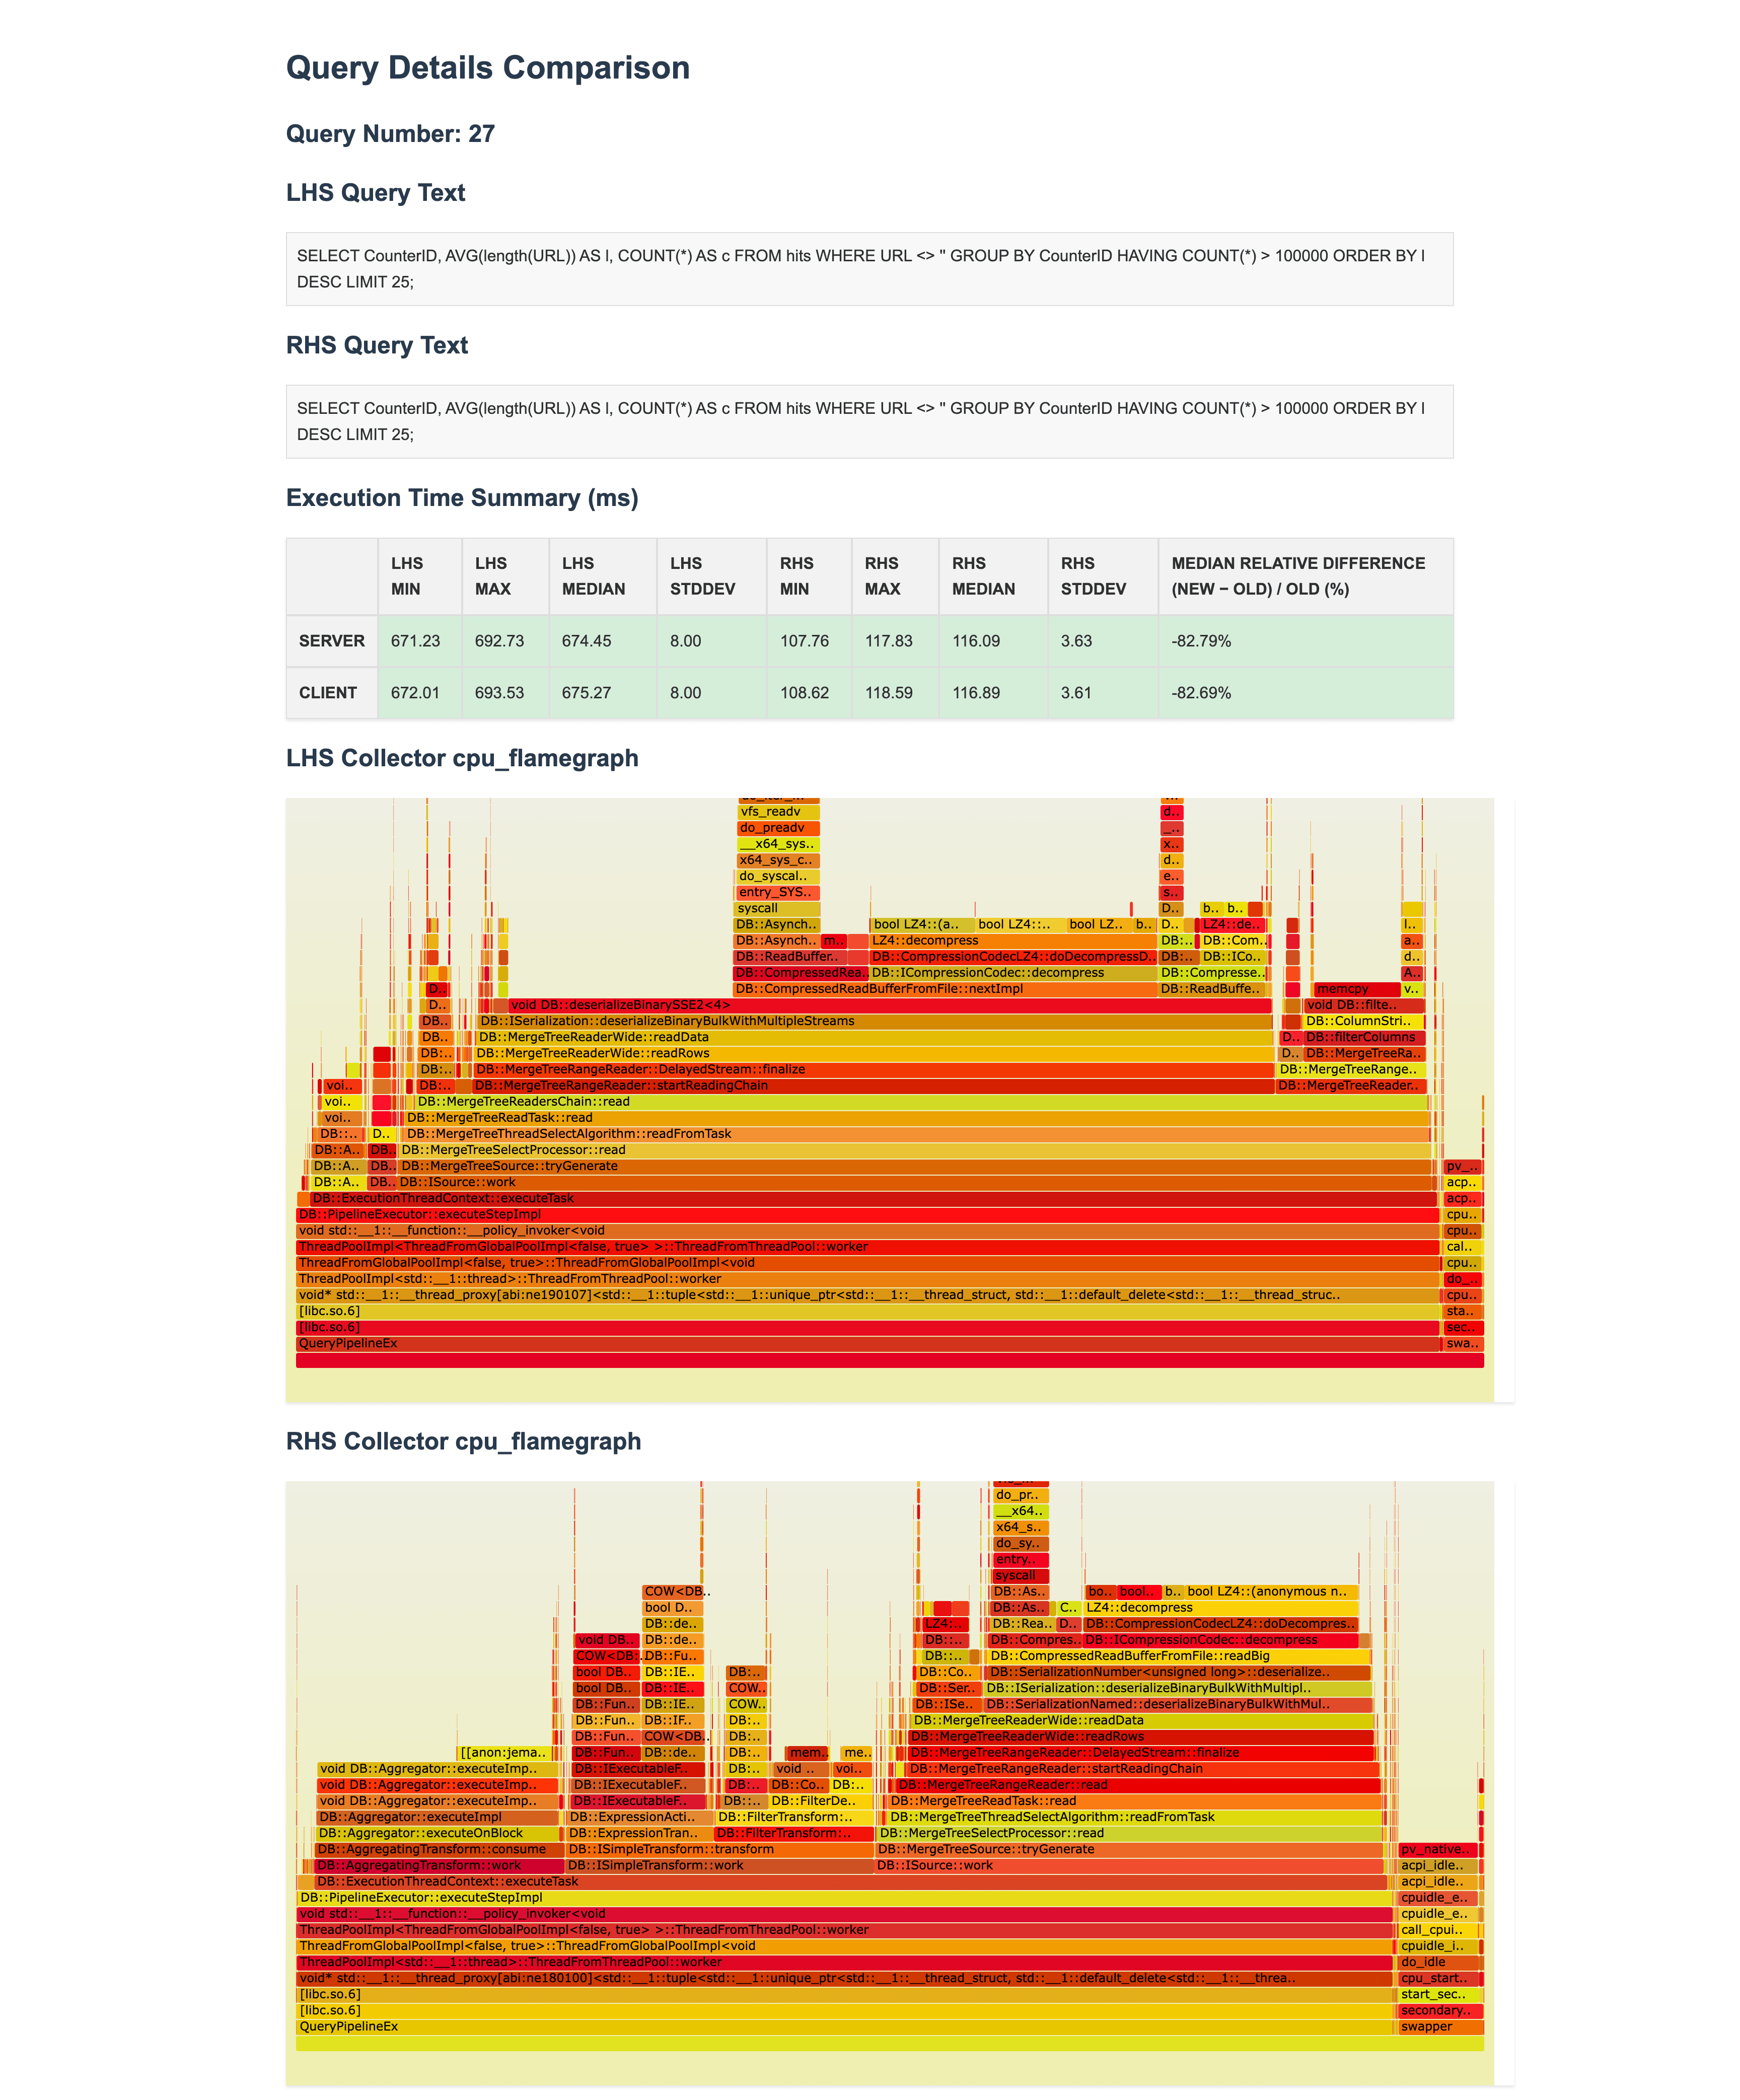
Then, if after your optimization, there are no regressions and your optimization brings only improvements, you can continue and apply the same process to the next potential place for optimization.
More information about paw tool you can find in paw github repository.
New features
I will describe all the new features that I implemented in Ursa 0.0.1 in order of importance:
-
Physical storage changes for String with Analyzer/Planner changes to support it
-
Partitioned GROUP BY optimization using 2 algorithms (copy chunks/indexes info)
String physical storage
In ClickHouse, String columns are serialized into a single file. For each individual string inside the column, the first string size is serialized, followed by the string raw data. This serialization/deserialization is very simple but is very slow in the case of many small-average-sized strings. You can read more about this particular place in the Power of small optimizations post.
There are a couple of problems with such serialization/deserialization:
-
In serialization/deserialization we have hot loop that needs to first write/read string size and then write/read string raw data. This does not allow to efficiently copy memory in large chunks into write buffer in case of serialization and from read buffer in case of deserialization. In ClickHouse this place is heavily optimized, but it is still huge bottleneck for queries that read a lot of strings.
-
For queries with some logic that depends only on string sizes and not on string values, it is impossible to read only string sizes. The whole column needs to be read completely during query execution. For example:
SELECT count(DISTINCT UserID) FROM hits WHERE URL != "". Such a query is dependent only on string size. It can be rewritten asSELECT count(DISTINCT UserID) FROM hits WHERE length(URL) != 0. It is possible to have infinite speedup for such queries if we can read only string sizes.
In Ursa, I decided to physically store String columns in two columns, similar to how Arrays are stored in ClickHouse. One column is used to store string sizes. Another column is used to store raw string data. This significantly speeds up queries that read a lot of strings.
Query performance in ClickHouse:
SELECT SearchPhrase, MIN(URL), MIN(Title), COUNT(*) AS c, COUNT(DISTINCT UserID) FROM hits
WHERE Title LIKE '%Google%' AND URL NOT LIKE '%.google.%' AND SearchPhrase <> ''
GROUP BY SearchPhrase ORDER BY c DESC LIMIT 10 FORMAT Null;

0 rows in set. Elapsed: 1.185 sec. Processed 100.00 million rows, 13.71 GB
Peak memory usage: 204.19 MiB.
Query performance in Ursa:
SELECT SearchPhrase, MIN(URL), MIN(Title), COUNT(*) AS c, COUNT(DISTINCT UserID) FROM hits
WHERE Title LIKE '%Google%' AND URL NOT LIKE '%.google.%' AND SearchPhrase <> ''
GROUP BY SearchPhrase ORDER BY c DESC LIMIT 10 FORMAT Null;

0 rows in set. Elapsed: 0.734 sec. Processed 22.86 million rows, 5.36 GB
Peak memory usage: 225.78 MiB.
There is around a 40% speedup in Ursa for such a query.
Additionally for converting such expressions as string_column ==/!= '' into length(string_column) ==/!= 0. I implemented query transformation as part of query planning.
Query performance in ClickHouse:
SELECT CounterID, AVG(length(URL)) AS l, COUNT(*) AS c FROM hits
WHERE URL <> '' GROUP BY CounterID HAVING COUNT(*) > 100000
ORDER BY l DESC LIMIT 25 FORMAT Null;

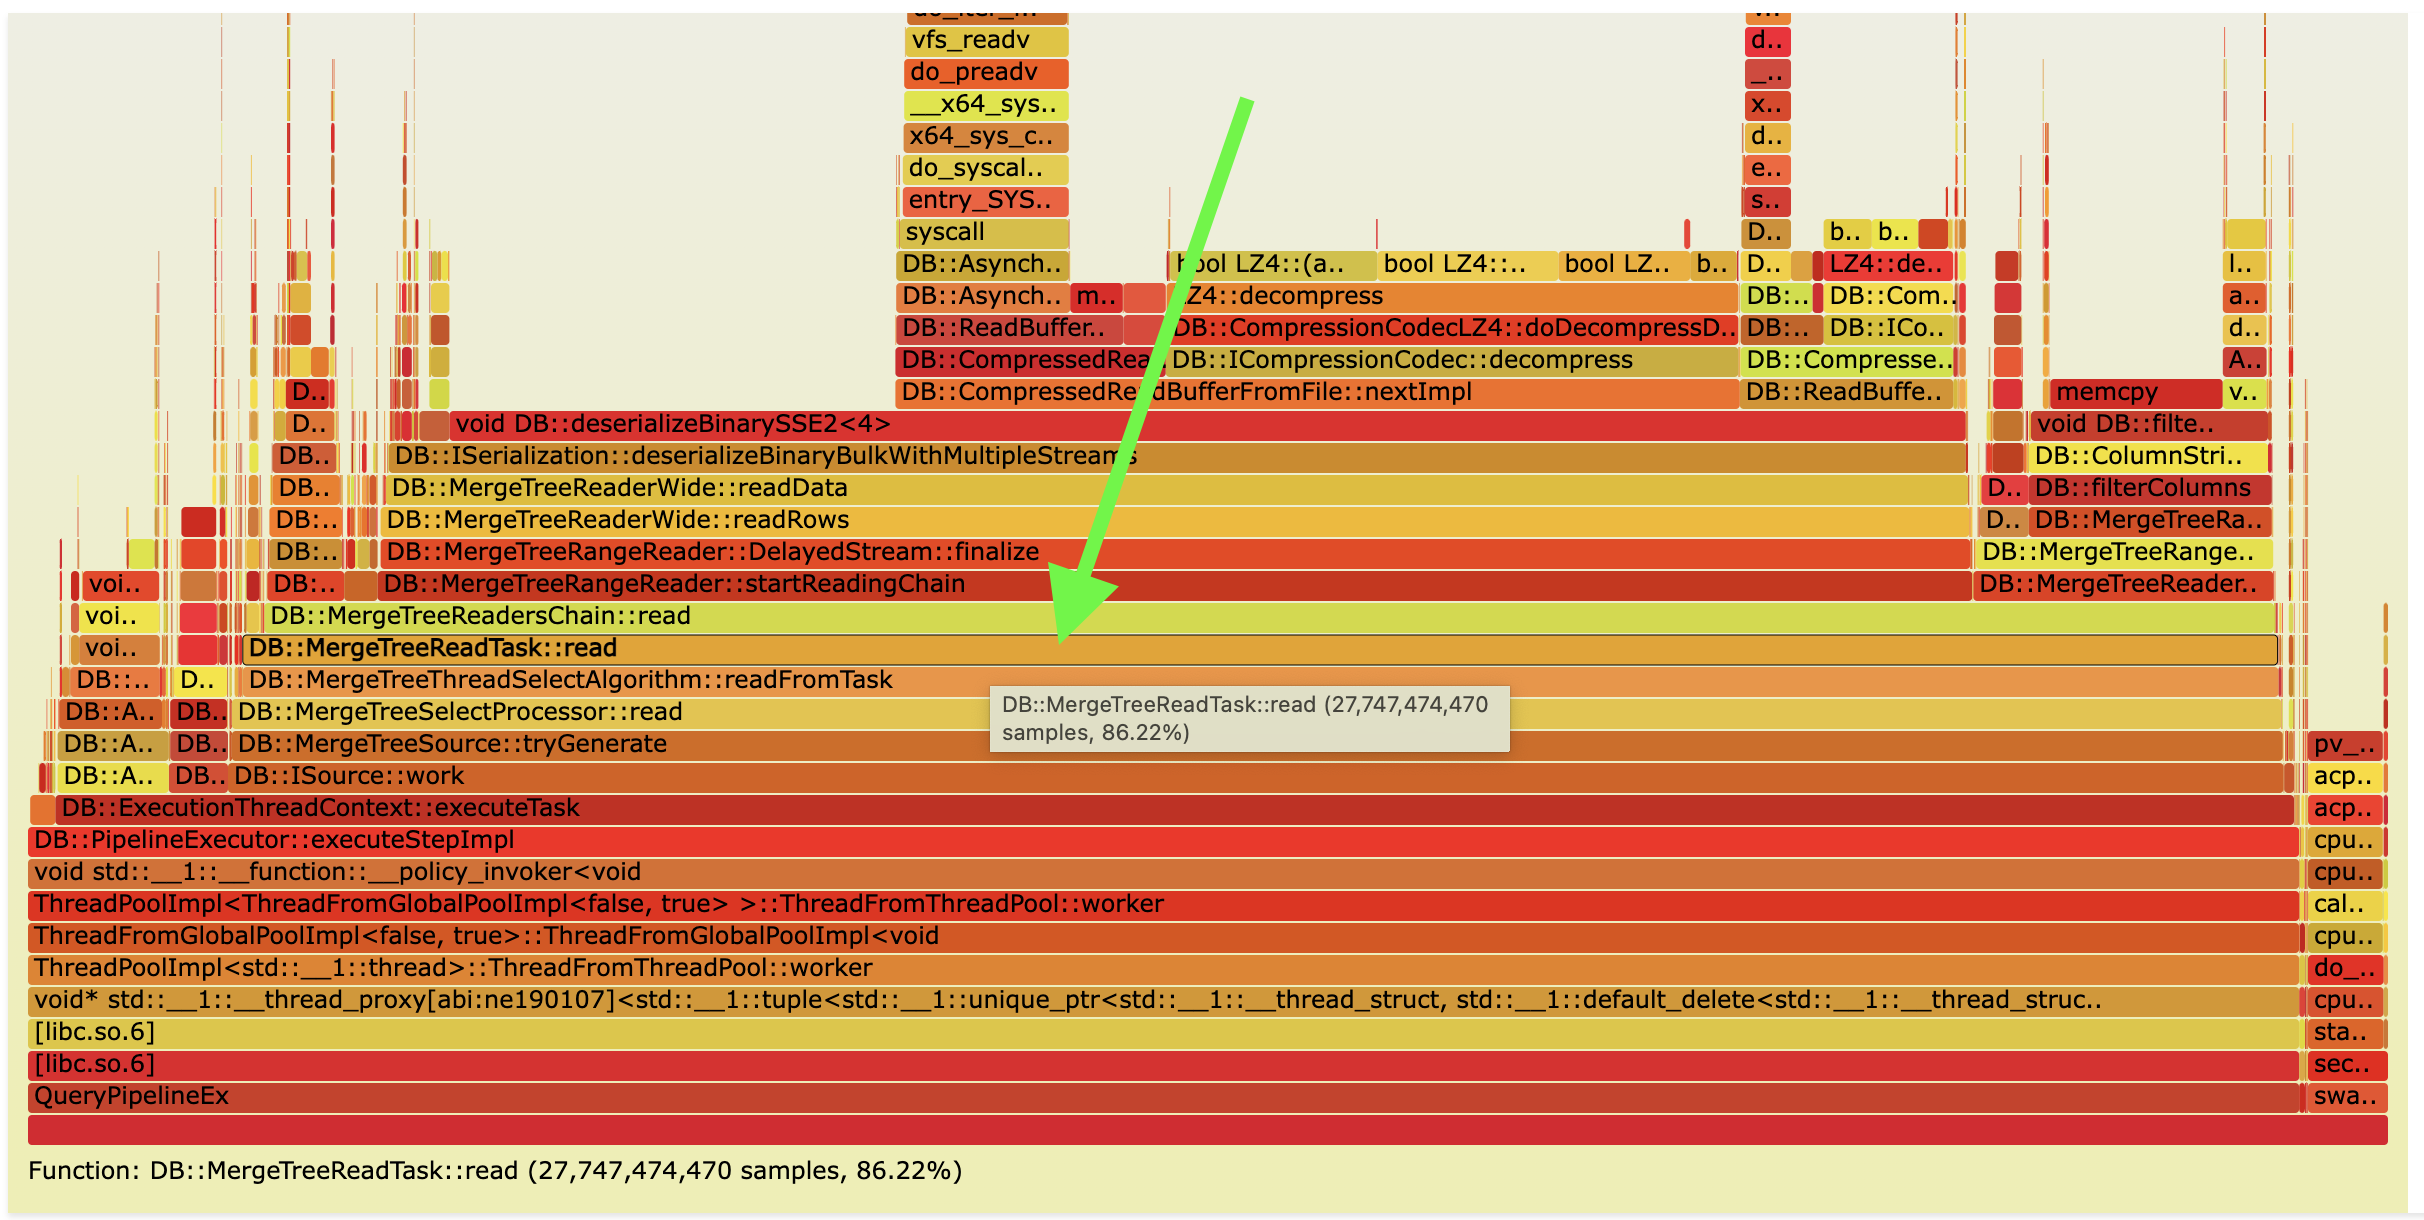
0 rows in set. Elapsed: 0.641 sec. Processed 100.00 million rows, 10.34 GB
Peak memory usage: 120.11 MiB.
Query flamegraph in ClickHouse:
Query performance in Ursa:
SELECT CounterID, AVG(length(URL)) AS l, COUNT(*) AS c FROM hits
WHERE URL <> '' GROUP BY CounterID HAVING COUNT(*) > 100000
ORDER BY l DESC LIMIT 25 FORMAT Null;

0 rows in set. Elapsed: 0.125 sec. Processed 100.00 million rows, 1.20 GB
Peak memory usage: 1.42 MiB.
Query flamegraph in Ursa:
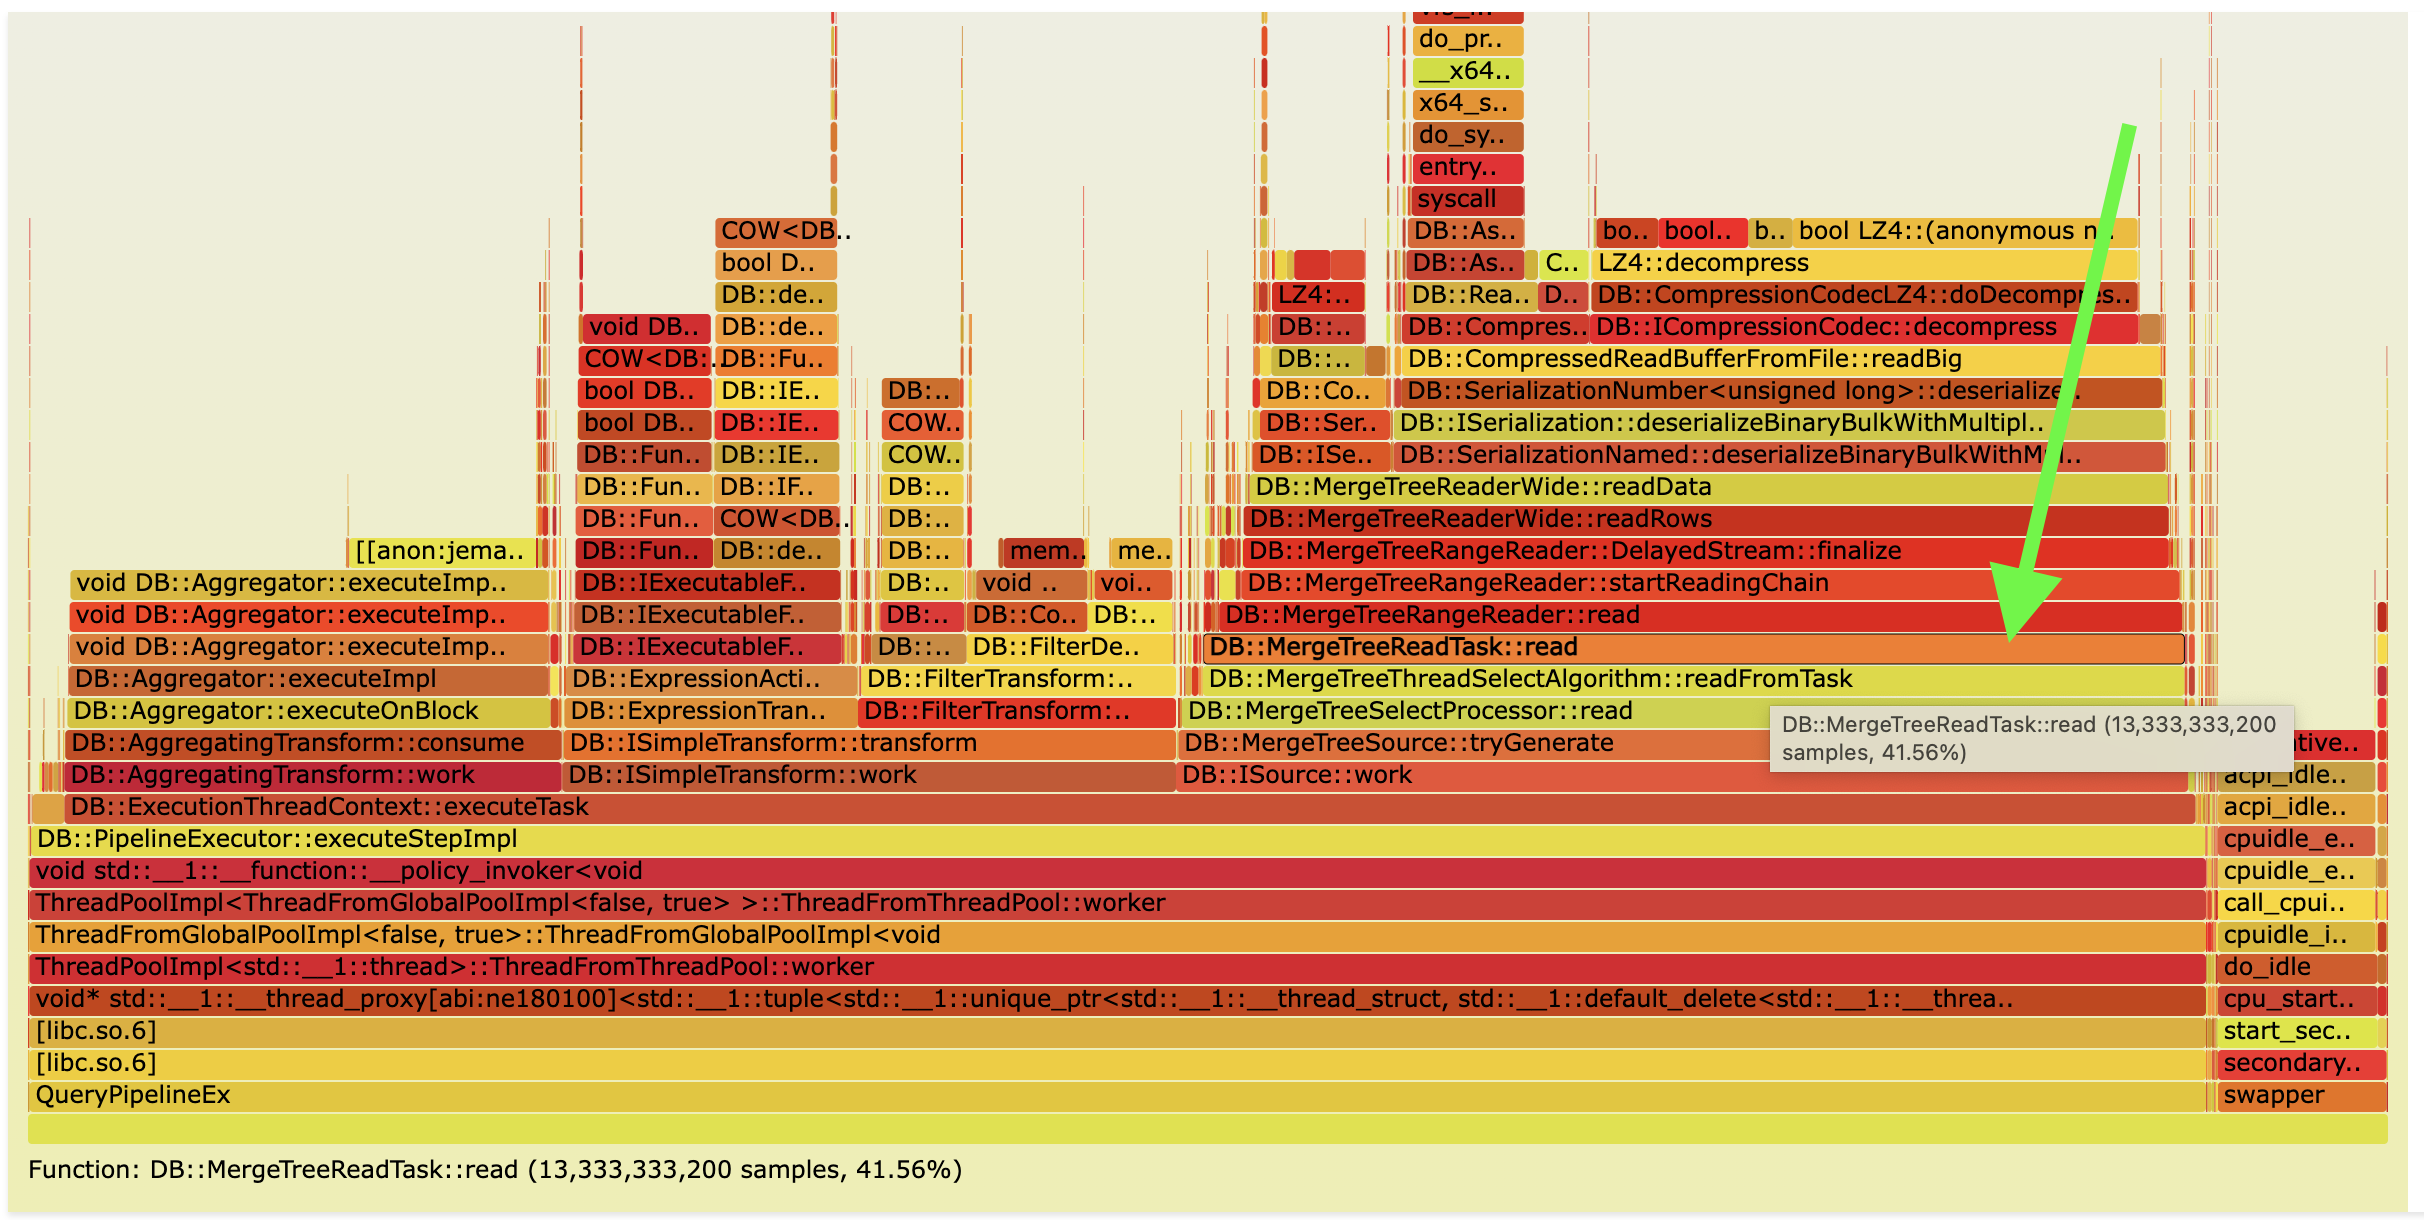
There is around an 80% speedup in Ursa for such a query. As you can see, this is an example of a query where we do not need to read the whole URL string column. You can also notice on the flame graph that we spend significantly less time reading data from MergeTree, so in theory, we can have infinite speedup for such queries.
This change is implemented in a backward incompatible way. It is possible to make it backward compatible and store string serialization information inside each part. However, the problem was that it also required a lot of changes in different places during query analysis, planning and low-level reading from MergeTree parts. So I decided that I will do this if I try to push it back to ClickHouse, but in Ursa 0.0.1 it is out of scope.
Partitioned GROUP BY
Currently, in ClickHouse, GROUP BY is executed in two stages:
- Data is aggregated by each thread separately into the local hash table.
- Data is merged in parallel by multiple threads into the single hash table.
In the case of high-cardinality aggregation, ClickHouse uses two-level hash tables, where the hash table consists of 256 hash tables. This helps to improve the parallelization of the second stage because each thread has a better granularity of work to perform.
This is a very fast approach for aggregation when the amount of unique keys is low. However, in the case of high-cardinality aggregation, the second stage can take most of the time because each thread will produce big local hash tables. The idea of optimization is to first partition data by hash so that each thread will work with a hash table of smaller size and avoid the merge stage completely. You can read more about this in this issue that I created a while ago.
There are two different ways to implement this:
-
Block of data can be split and copied during partitioning between different aggregation threads. This way is transparent to aggregation threads and aggregation code is the same. This strategy is implemented in Ursa with the
aggregation_default_scatter_algorithm = 'copy_chunks'. -
With a block of data for each aggregation thread, it is possible to send additional column with indexes from the block that this thread needs to aggregate. This strategy is implemented in Ursa with the
aggregation_default_scatter_algorithm = 'indexes_info'.
In Ursa, I implemented both methods. The second method is significantly faster when the block contains big columns like Strings or Arrays because, for such columns, you can spend a lot of time copying rows. However, second method required a lot of changes in aggregator/aggregate functions, and during my tests, I decided to just disable partitioned aggregation for big columns and always use the first method because it is much faster in case we have small numeric columns.
To properly dispatch between partitioned and ordinary GROUP BY, I used runtime statistics that are collected in ClickHouse during GROUP BY. Using these statistics, it is possible to understand if aggregation is high-cardinality and dispatch to the necessary method.
Query performance in ClickHouse:
SELECT WatchID, ClientIP, COUNT(*) AS c, SUM(IsRefresh), AVG(ResolutionWidth) FROM hits
GROUP BY WatchID, ClientIP ORDER BY c DESC LIMIT 10 FORMAT Null;

0 rows in set. Elapsed: 4.061 sec. Processed 100.00 million rows, 1.60 GB
Peak memory usage: 10.27 GiB.
Query flamegraph in ClickHouse:
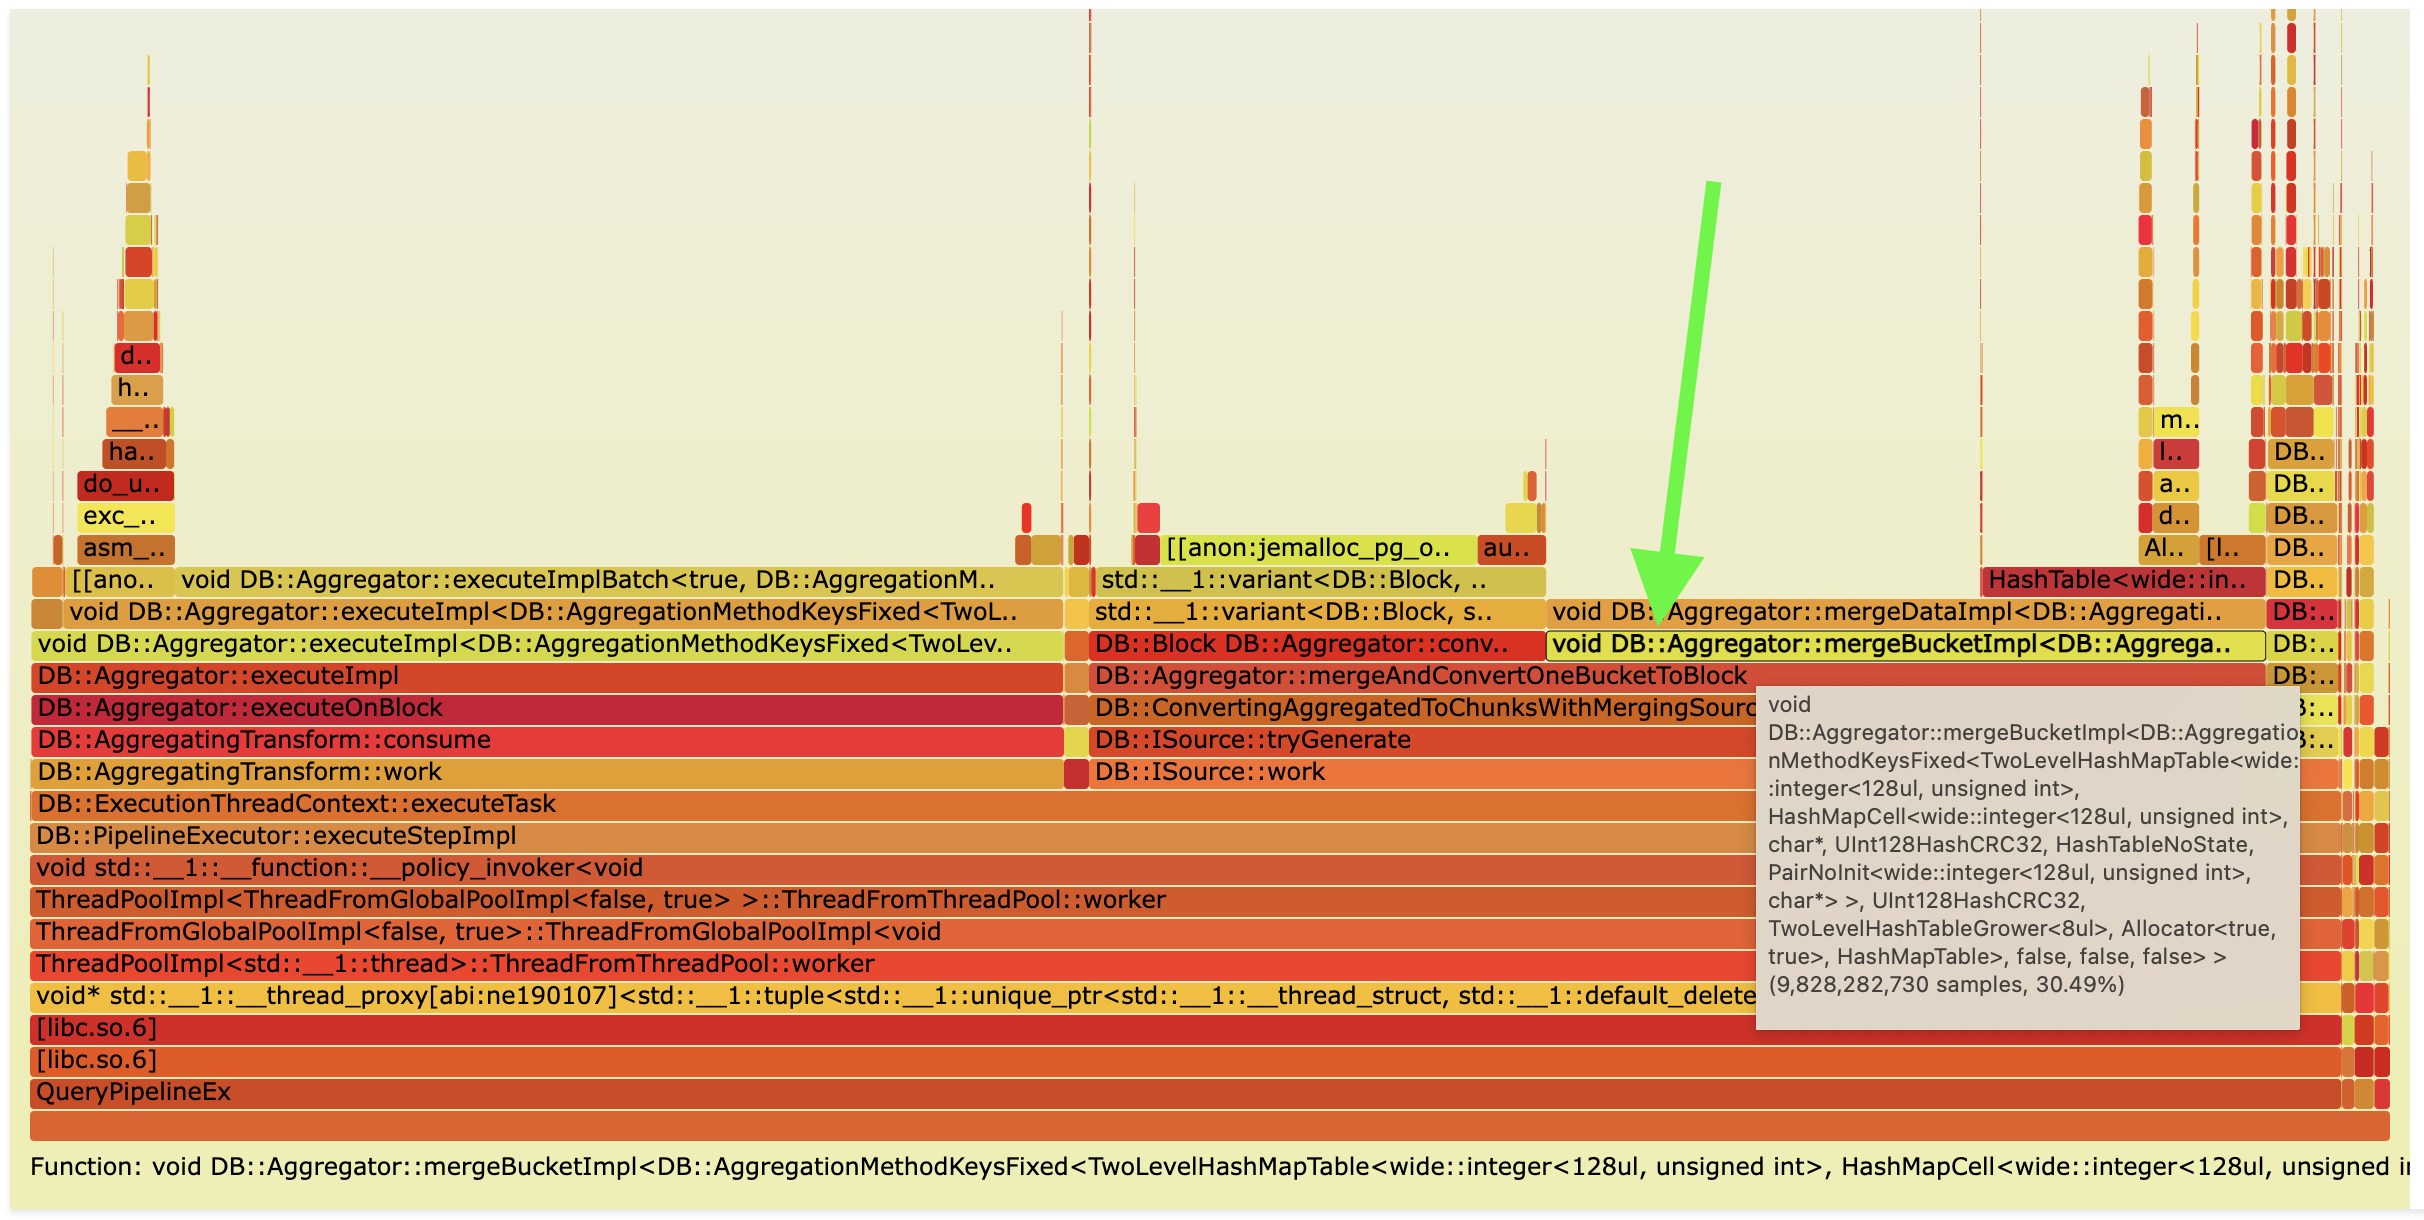
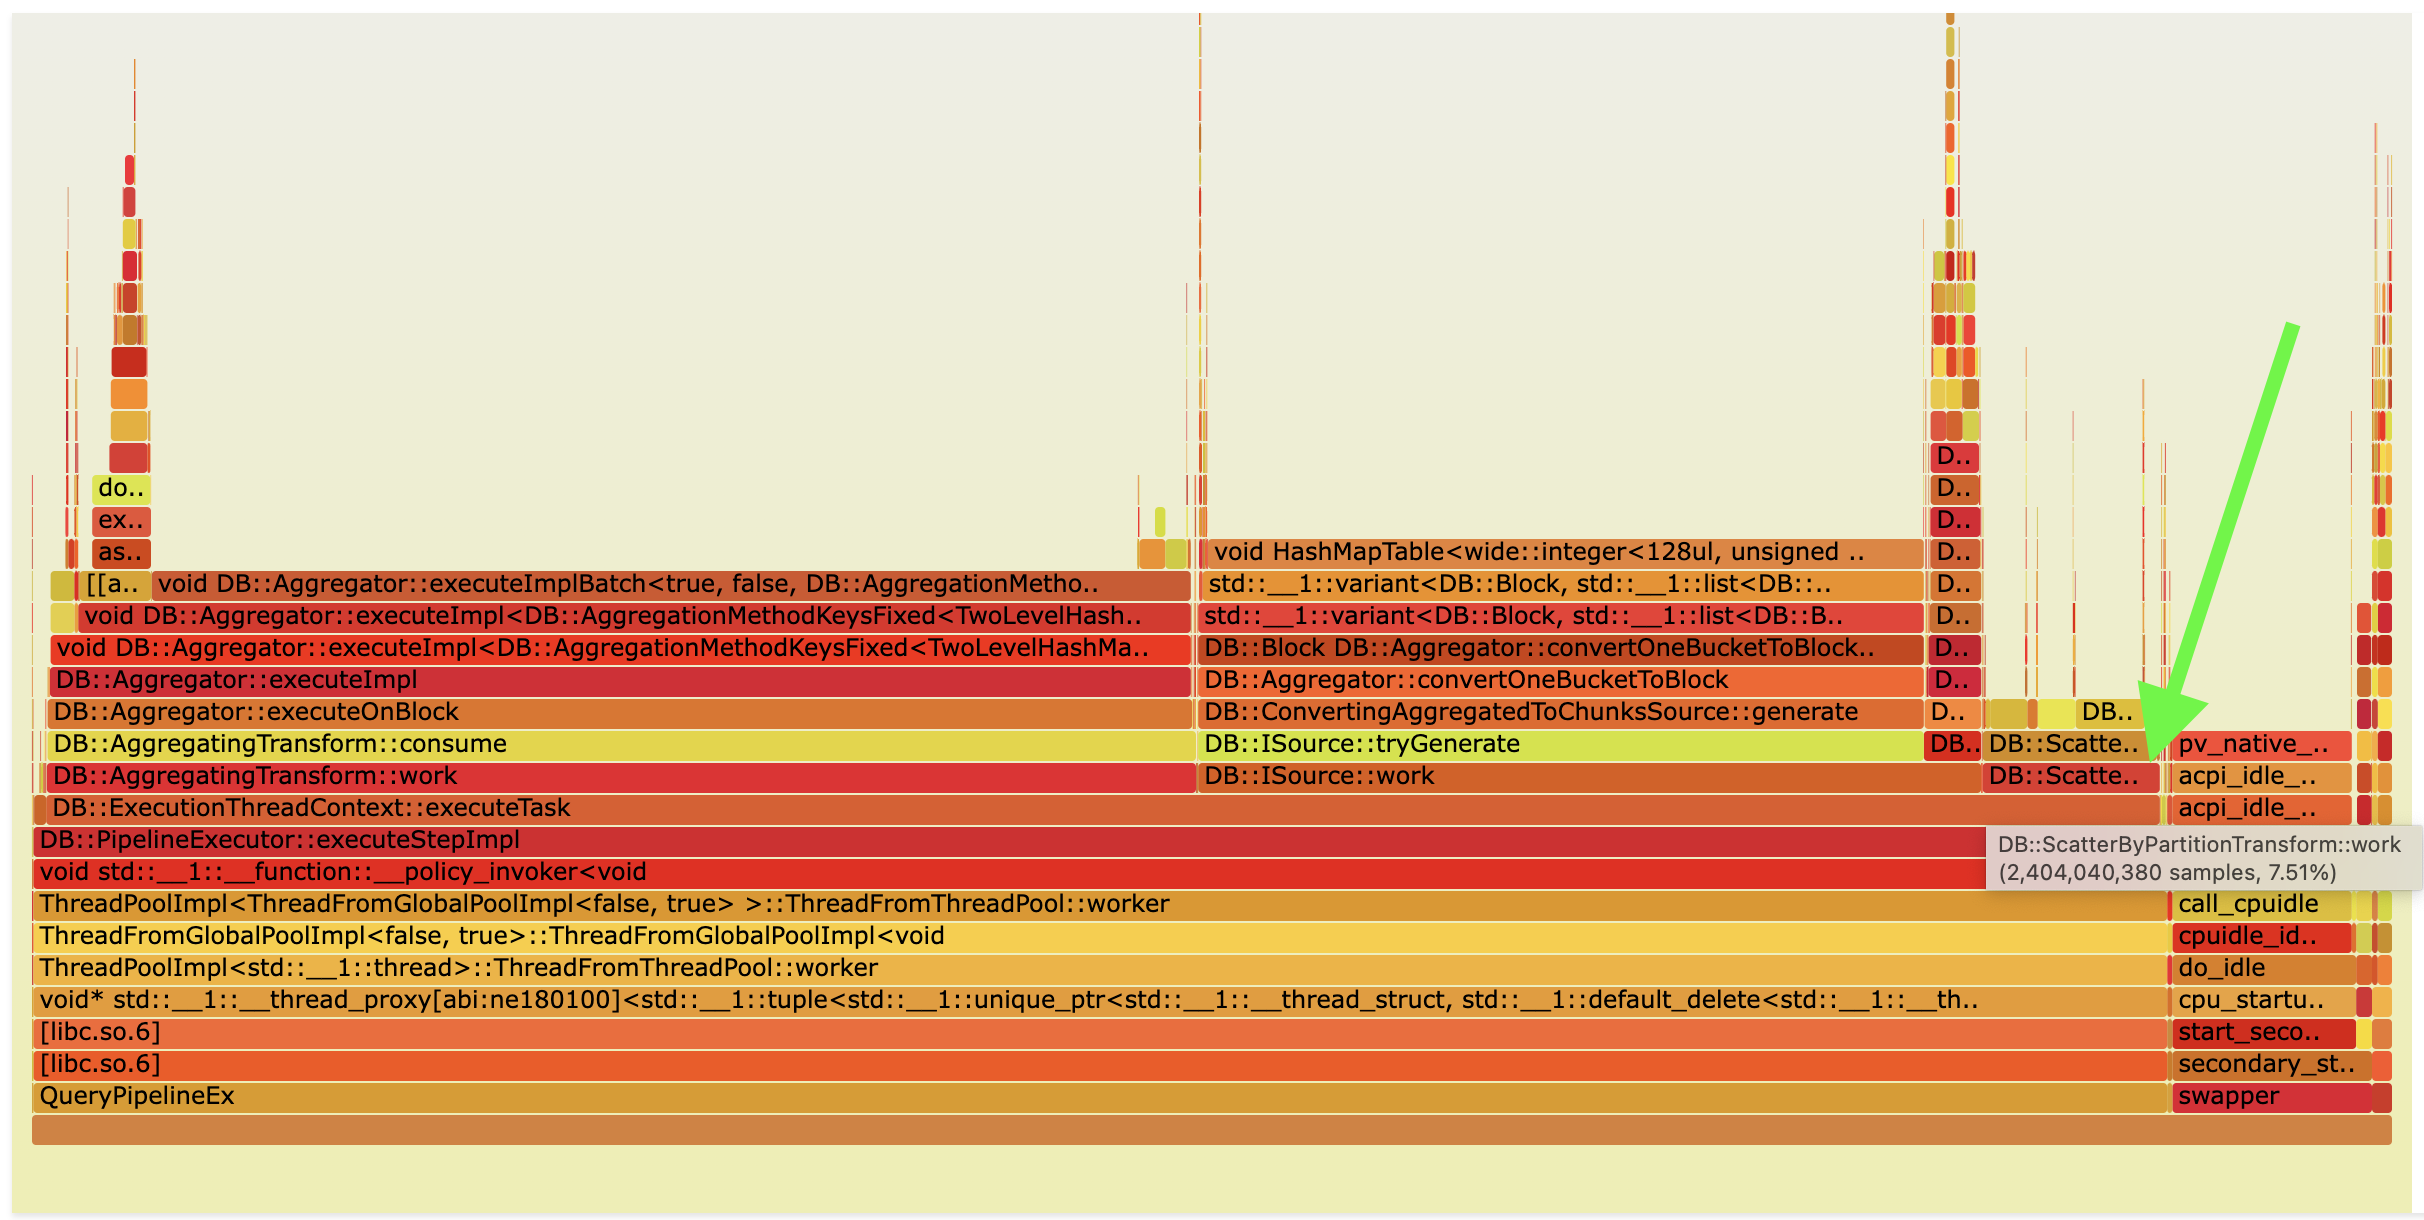
On flame graph, you can see that we spend a lot of time merging aggregated data.
In ClickHouse pipeline looks like this:
EXPLAIN PIPELINE SELECT WatchID, ClientIP, COUNT(*) AS c, SUM(IsRefresh), AVG(ResolutionWidth)
FROM hits GROUP BY WatchID, ClientIP ORDER BY c DESC LIMIT 10

┌─explain───────────────────────────────────────────────────────────────────────────┐
│ (Expression)                                                                      │
│ ExpressionTransform                                                               │
│   (Limit)                                                                         │
│   Limit                                                                           │
│     (Sorting)                                                                     │
│     MergingSortedTransform 16 → 1                                                 │
│       MergeSortingTransform × 16                                                  │
│         LimitsCheckingTransform × 16                                              │
│           PartialSortingTransform × 16                                            │
│             (Expression)                                                          │
│             ExpressionTransform × 16                                              │
│               (Aggregating)                                                       │
│               Resize 16 → 16                                                      │
│                 AggregatingTransform × 16                                         │
│                   (Expression)                                                    │
│                   ExpressionTransform × 16                                        │
│                     (ReadFromMergeTree)                                           │
│                     MergeTreeSelect(pool: ReadPool, algorithm: Thread) × 16 0 → 1 │
└───────────────────────────────────────────────────────────────────────────────────┘
Query performance in Ursa:
SELECT WatchID, ClientIP, COUNT(*) AS c, SUM(IsRefresh), AVG(ResolutionWidth) FROM hits
GROUP BY WatchID, ClientIP ORDER BY c DESC LIMIT 10 FORMAT Null;

0 rows in set. Elapsed: 2.460 sec. Processed 100.00 million rows, 1.60 GB
Peak memory usage: 10.06 GiB.
There is around 40% speedup in Ursa for such a query.
In Ursa, the pipeline looks like this. You can notice that ScatterByPartitionTransform is added to the pipeline before AggregatingTransform.
EXPLAIN PIPELINE SELECT WatchID, ClientIP, COUNT(*) AS c, SUM(IsRefresh), AVG(ResolutionWidth)
FROM hits GROUP BY WatchID, ClientIP ORDER BY c DESC LIMIT 10

┌─explain───────────────────────────────────────────────────────────────────────────────┐
│ (Expression)                                                                          │
│ ExpressionTransform                                                                   │
│   (Limit)                                                                             │
│   Limit                                                                               │
│     (Sorting)                                                                         │
│     MergingSortedTransform 16 → 1                                                     │
│       MergeSortingTransform × 16                                                      │
│         LimitsCheckingTransform × 16                                                  │
│           PartialSortingTransform × 16                                                │
│             (Expression)                                                              │
│             ExpressionTransform × 16                                                  │
│               (Aggregating)                                                           │
│               Resize 16 → 16                                                          │
│                 AggregatingTransform × 16                                             │
│                   Resize × 16 16 → 1                                                  │
│                     ScatterByPartitionTransform × 16 1 → 16                           │
│                       (Expression)                                                    │
│                       ExpressionTransform × 16                                        │
│                         (ReadFromMergeTree)                                           │
│                         MergeTreeSelect(pool: ReadPool, algorithm: Thread) × 16 0 → 1 │
└───────────────────────────────────────────────────────────────────────────────────────┘
Flame graph of this query in Ursa after optimization:
Query performance in Ursa with disabled partitioned aggregation using use_scatter_aggregation_based_on_statistics = 0:
SELECT WatchID, ClientIP, COUNT(*) AS c, SUM(IsRefresh), AVG(ResolutionWidth) FROM hits
GROUP BY WatchID, ClientIP ORDER BY c DESC LIMIT 10 FORMAT Null
SETTINGS use_scatter_aggregation_based_on_statistics = 0;

0 rows in set. Elapsed: 3.513 sec. Processed 100.00 million rows, 1.60 GB
Peak memory usage: 10.19 GiB.
Additionally, during my tests, I noticed that this optimization puts a lot of pressure on the executor because processors in the pipeline are too interconnected, and this can potentially lead to a lot of contention on internal executor locks. I will talk more about this in the future improvements section about executor.
Aggregation ORDER BY LIMIT push down before materialization
This optimization is very important. Let’s take a look at the query:
SELECT UserID, extract(minute FROM EventTime) AS m, SearchPhrase, COUNT(*) FROM hits
GROUP BY UserID, m, SearchPhrase ORDER BY COUNT(*) DESC LIMIT 10;
Flame graph of such query in ClickHouse:
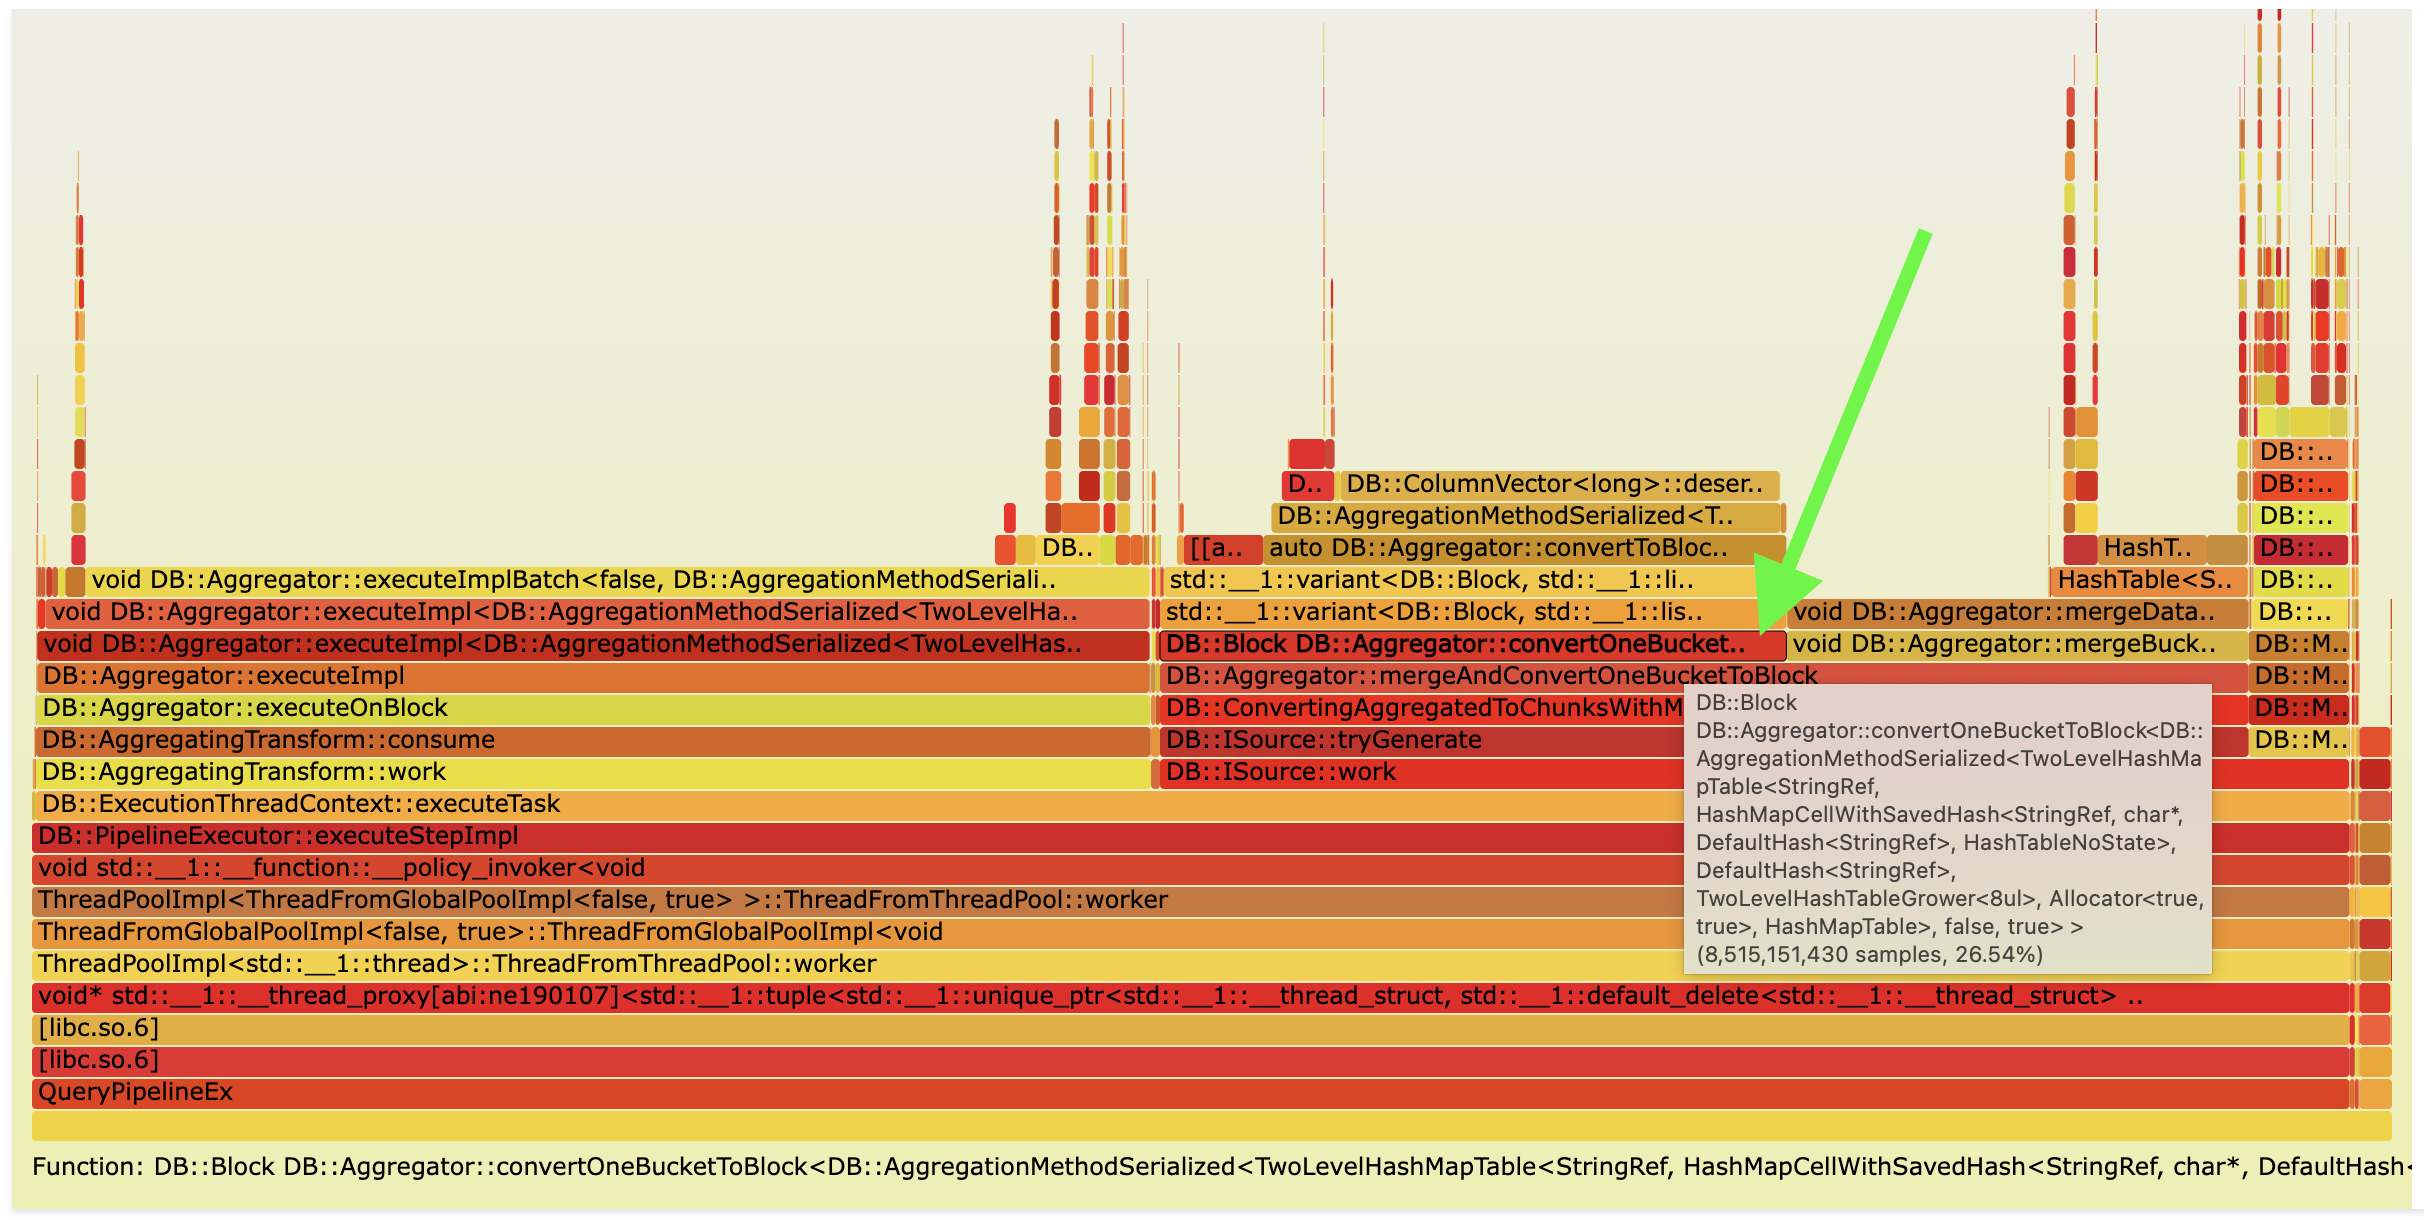
As you can see, we spend a lot of time converting serialized data in hash tables after aggregation to blocks of data in Aggregator::convertToBlockImplFinal. It is possible to avoid deserialization for many rows by fusing ORDER BY LIMIT and the final stage of aggregation together. As you can see in the query, there is ORDER BY COUNT(*) DESC LIMIT 10. So we can materialize only columns necessary for ORDER BY, put them in a heap to compute top-k rows, and then only for these rows perform conversion to blocks of data.
Query performance in ClickHouse:
SELECT UserID, extract(minute FROM EventTime) AS m, SearchPhrase, COUNT(*) FROM hits
GROUP BY UserID, m, SearchPhrase ORDER BY COUNT(*) DESC LIMIT 10 FORMAT Null;

0 rows in set. Elapsed: 3.484 sec. Processed 100.00 million rows, 2.84 GB
Peak memory usage: 8.21 GiB.
Query performance in Ursa:
SELECT UserID, extract(minute FROM EventTime) AS m, SearchPhrase, COUNT(*) FROM hits
GROUP BY UserID, m, SearchPhrase ORDER BY COUNT(*) DESC LIMIT 10 FORMAT Null;

0 rows in set. Elapsed: 2.910 sec. Processed 100.00 million rows, 2.84 GB
Peak memory usage: 8.15 GiB.
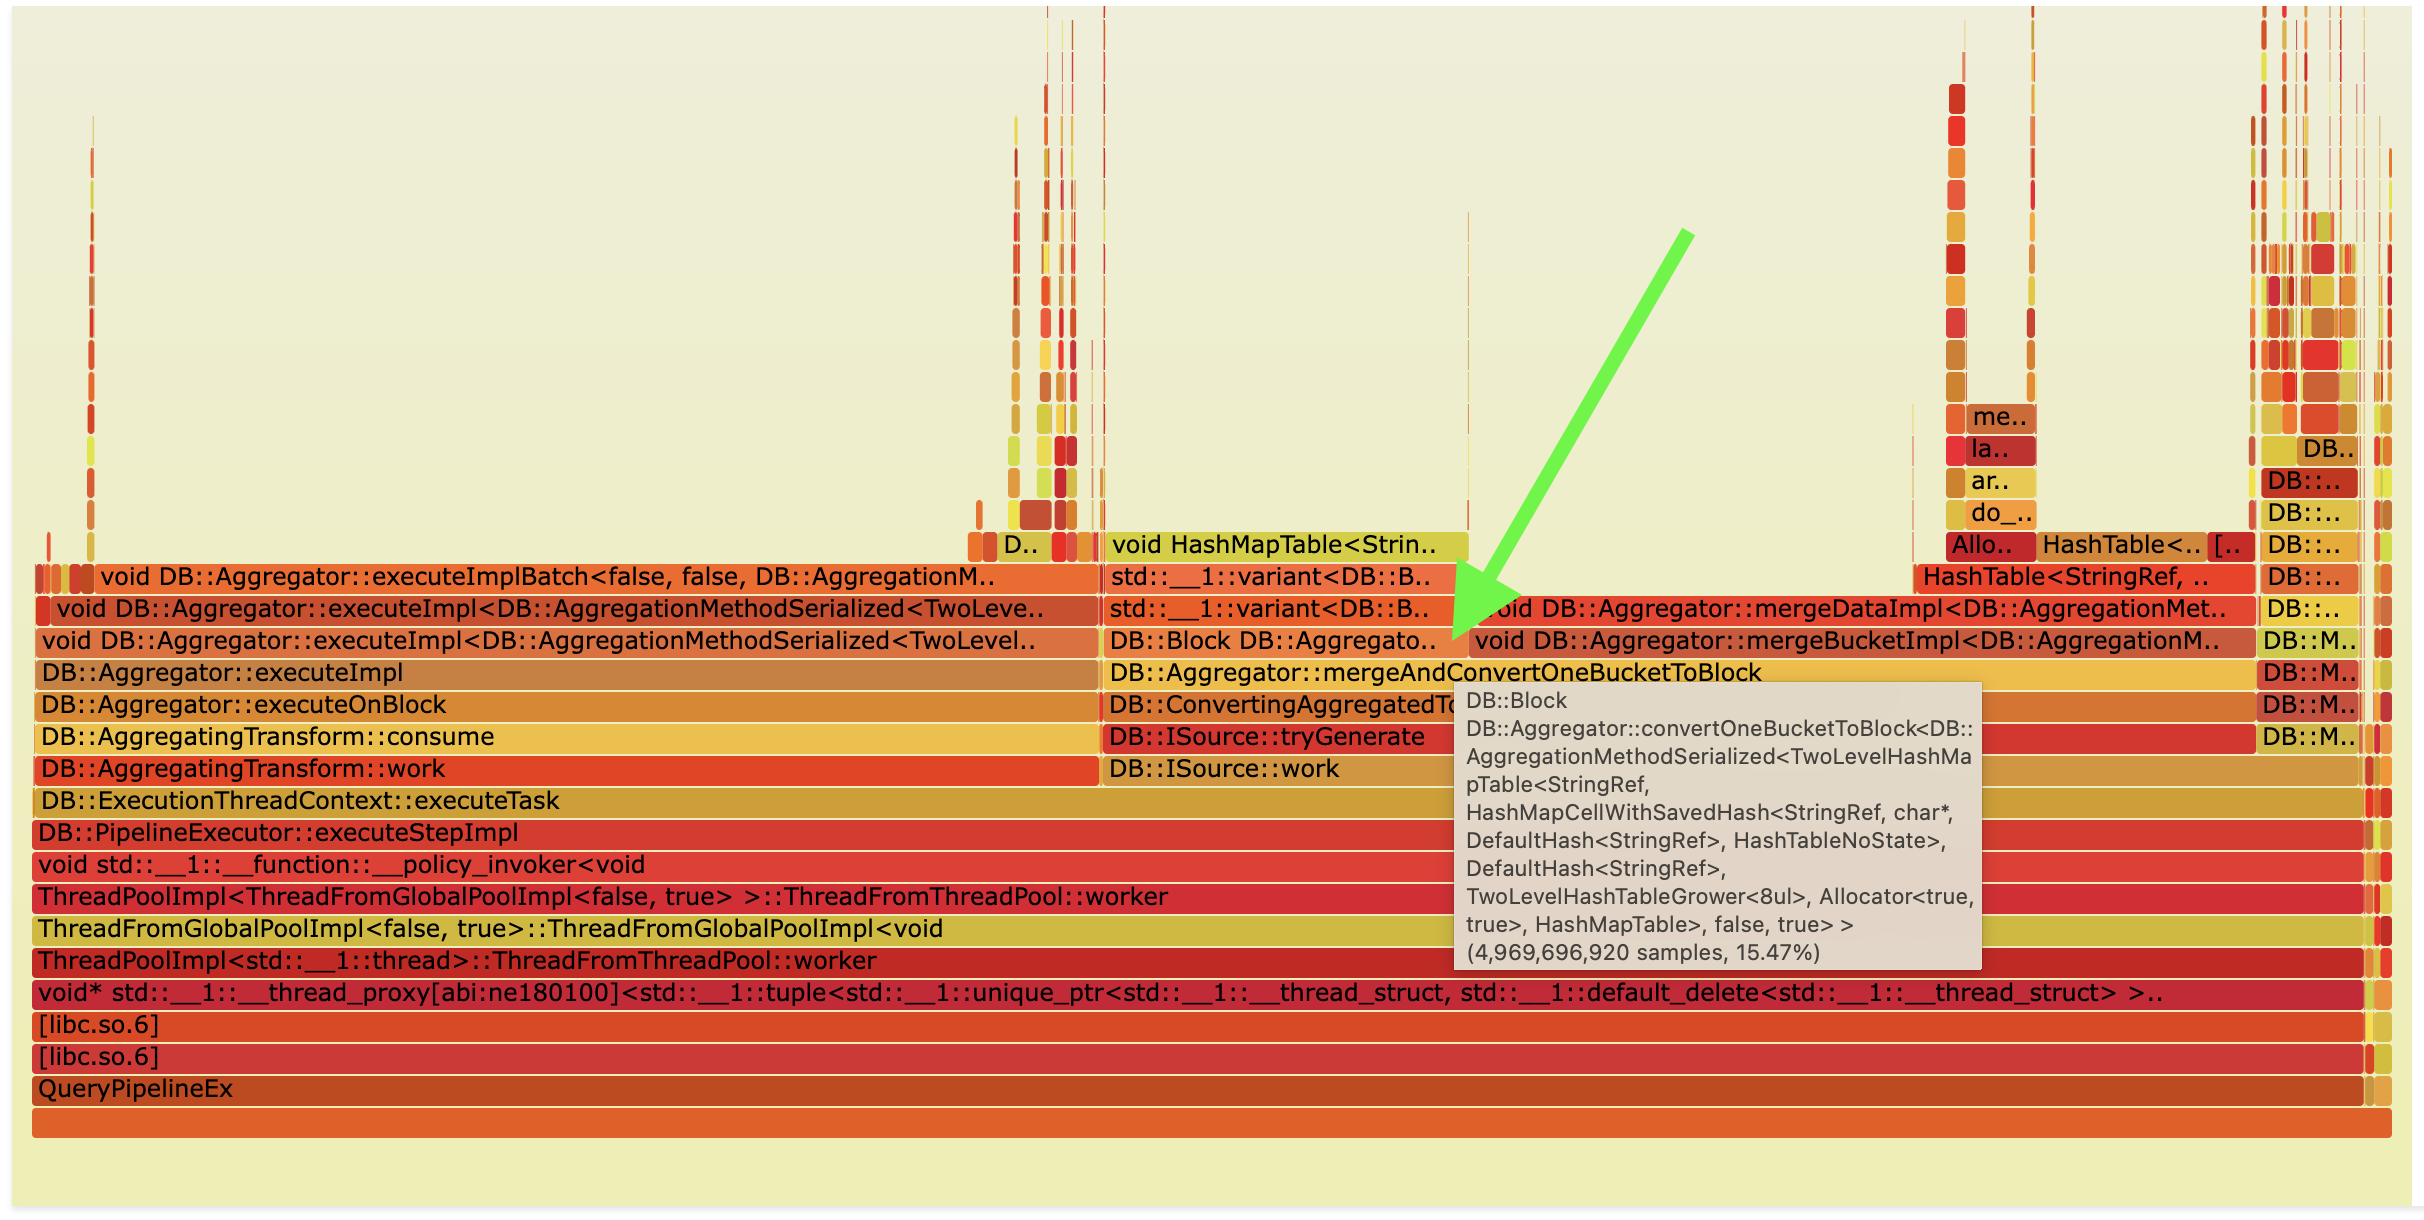
Around 16% speedup in Ursa for such query.
Flame graph of such query in Ursa:
Query performance in Ursa with disabled aggregation ORDER BY LIMIT push down optimization using aggregation_apply_sort_with_limit_before_materialization = 0:
SELECT UserID, extract(minute FROM EventTime) AS m, SearchPhrase, COUNT(*) FROM hits
GROUP BY UserID, m, SearchPhrase ORDER BY COUNT(*) DESC LIMIT 10 FORMAT Null
SETTINGS aggregation_apply_sort_with_limit_before_materialization = 0;

0 rows in set. Elapsed: 3.484 sec. Processed 100.00 million rows, 2.84 GB
Peak memory usage: 8.21 GiB.
It is also possible to optimize with operator fusion a bit different queries, where ORDER BY after GROUP BY does not depend on any computed aggregate functions. For example, such query:
SELECT UserID, extract(minute FROM EventTime) AS m, SearchPhrase, COUNT(*) FROM hits
GROUP BY UserID, m, SearchPhrase ORDER BY SearchPhrase DESC LIMIT 10;
Or if you have a query without ORDER BY only with LIMIT after GROUP BY:
SELECT UserID, SearchPhrase, COUNT(*) FROM hits GROUP BY UserID, SearchPhrase LIMIT 10;
Such queries are rare, but for such queries, you can fuse aggregation, ORDER BY, and LIMIT into a single operator. Check this issue for more details issue.
Runtime bit indexes
When I implemented this feature, I did not know that the ClickHouse team already had the same idea that is explained in this issue. Here is a blog post about this feature from ClickHouse query condition cache blog post.
When we read data from MergeTree, we read this data in granules, so for each granule, we can understand if this granule completely passed the filter or not and store this information in the cache. This information can then be used for similar or the same filter to understand which granules can be completely skipped from reading. For example, if you run a query with the filter FROM hits WHERE UserID = 1 and then a similar query with a different filter FROM hits WHERE UserID = 1 AND URL LIKE %google%, you can reuse bit indexes that were populated by the first query WHERE UserID = 1 predicate.
Currently, this feature is disabled by default in ClickHouse upstream. It is implemented in Ursa in a slightly different way than it is in upstream. In Ursa this feature is only implemented for predicates that were pushed to PREWHERE. I decided to implement it like this because this feature makes sense only if the predicate is selective, and such predicates are pushed to PREWHERE most of the time anyway. This significantly simplifies the whole implementation. In upstream, this feature is also implemented for the Filter operator, and this requires pushing information from the low-level MergeTree reads up to the Filter processor. In the case of Ursa, this feature is implemented locally in MergeTree readers.
Query performance in ClickHouse:
SELECT UserID FROM hits WHERE UserID = 435090932899640449 FORMAT Null;

0 rows in set. Elapsed: 0.015 sec. Processed 17.87 million rows, 142.95 MB
Peak memory usage: 562.28 KiB.
Query performance in Ursa:
SELECT UserID FROM hits WHERE UserID = 435090932899640449 FORMAT Null;

0 rows in set. Elapsed: 0.002 sec. Processed 8.19 thousand rows, 65.54 KB
Peak memory usage: 5.38 KiB.
There is around 8x speedup in Ursa for such a query. This speedup is not only because of bit indexes but also because of index analysis cache.
I also added introspection for this feature in EXPLAIN indexes = 1:
EXPLAIN indexes = 1 SELECT UserID FROM hits WHERE UserID = 435090932899640449;

┌─explain─────────────────────────────────────────────────────────────────┐
│ Expression ((Project names + Projection))                               │
│   Expression                                                            │
│     ReadFromMergeTree (default.hits)                                    │
│     Indexes:                                                            │
│       PrimaryKey                                                        │
│         Keys:                                                           │
│           UserID                                                        │
│         Condition: (UserID in [435090932899640449, 435090932899640449]) │
│         Parts: 1/1                                                      │
│         Granules: 2237/12488                                            │
│       Bit                                                               │
│         Parts: 1/1                                                      │
│         Granules: 1/2237                                                │
└─────────────────────────────────────────────────────────────────────────┘
Interval indexes
In Ursa, in the MergeTree table for each granule min/max value and concrete row number with min/max value are stored for each column. It is similar to min/max skipping indexes in ClickHouse, but additionally, a concrete row number with min/max value is stored. Such index is lazily loaded in memory and can be pruned periodically.
Such interval indexes help speed up a lot of queries. For example, let’s take a look at such query:
SELECT * FROM hits ORDER BY EventTime LIMIT 10;
For each MergeTree part during the read planning stage, we can sort min values for each granule and take the top 10. Then, we can read only 10 granules because the necessary rows will not be in any other granules.
Query performance in ClickHouse:
SELECT * FROM hits ORDER BY EventTime LIMIT 10 FORMAT Null;

0 rows in set. Elapsed: 0.757 sec. Processed 100.00 million rows, 1.20 GB
Peak memory usage: 16.75 MiB.
Query performance in Ursa:
SELECT * FROM hits ORDER BY EventTime LIMIT 10 FORMAT Null;

0 rows in set. Elapsed: 0.080 sec. Processed 75.37 thousand rows, 55.57 MB
Peak memory usage: 38.18 MiB.
There is around 10x speedup in Ursa for such a query.
I also added introspection for this feature in EXPLAIN indexes = 1:
EXPLAIN indexes = 1 SELECT * FROM hits ORDER BY EventTime LIMIT 10;

┌─explain─────────────────────────────────────────────────────────────────────────────────────────┐
│ Expression (Project names)                                                                      │
│   Limit (preliminary LIMIT (without OFFSET))                                                    │
│     Sorting (Sorting for ORDER BY)                                                              │
│       Expression ((Before ORDER BY + (Projection + Change column names to column identifiers))) │
│         ReadFromMergeTree (default.hits)                                                        │
│         Indexes:                                                                                │
│           PrimaryKey                                                                            │
│             Condition: true                                                                     │
│             Parts: 1/1                                                                          │
│             Granules: 12488/12488                                                               │
│           Interval                                                                              │
│             Parts: 1/1                                                                          │
│             Granules: 10/12488                                                                  │
└─────────────────────────────────────────────────────────────────────────────────────────────────┘
I wanted to use interval indexes for queries like this: SELECT SearchPhrase FROM hits WHERE SearchPhrase <> '' ORDER BY EventTime LIMIT 10;, that is why with each min/max value, I also decided to store concrete row with min/max value in the granule. I can potentially apply a filter to rows with min/max values and then extract necessary rows from granules for other columns. This would work in the case of the presented query because the filter is not selective. However, I did not have time to implement this optimization yet.
I also used interval indexes for simple min/max query optimization, similar to optimize_trivial_count_query optimization in ClickHouse.
Query performance in ClickHouse:
SELECT MIN(EventDate), MAX(EventDate) FROM hits FORMAT Null;

1 row in set. Elapsed: 0.010 sec. Processed 100.00 million rows, 199.99 MB
Peak memory usage: 153.76 KiB.
Query performance in Ursa:
SELECT MIN(EventDate), MAX(EventDate) FROM hits FORMAT Null;

1 row in set. Elapsed: 0.001 sec.
There is around 10x speedup in Ursa for such a query.
Query performance in Ursa with disabled trivial min max query optimization using optimize_trivial_min_max_query = 0:
SELECT MIN(EventDate), MAX(EventDate) FROM hits FORMAT Null
SETTINGS optimize_trivial_min_max_query = 0;

1 row in set. Elapsed: 0.009 sec. Processed 100.00 million rows, 199.99 MB
Peak memory usage: 154.10 KiB.
It is also possible to use interval indexes as usual min/max skip indexes in ClickHouse. However, this needs to be carefully implemented and tested because, most of the time, it will not be beneficial.
Index analysis cache
In ClickHouse, it is possible that for low-latency queries primary key index analysis or skipping index analysis will become a bottleneck. To avoid this, we can cache index analysis results in memory for specific predicates inside parts. This optimization is implemented in Ursa.
Let’s take a look at this query in Ursa with disabled index analysis cache and bit indexes:
SELECT UserID FROM hits WHERE UserID = 435090932899640449 FORMAT Null
SETTINGS use_index_analysis_cache = 0, use_bit_indexes = 0;

0 rows in set. Elapsed: 0.016 sec. Processed 17.66 million rows, 141.29 MB
Peak memory usage: 41.05 KiB.
If we enable the index analysis cache, we will get around 40% performance improvement:
SELECT UserID FROM hits WHERE UserID = 435090932899640449 FORMAT Null
SETTINGS use_index_analysis_cache = 1, use_bit_indexes = 0;

0 rows in set. Elapsed: 0.010 sec. Processed 17.66 million rows, 141.29 MB
Peak memory usage: 40.18 KiB.
If we disable the index analysis cache and enable bit indexes:
SELECT UserID FROM hits WHERE UserID = 435090932899640449 FORMAT Null
SETTINGS use_index_analysis_cache = 0, use_bit_indexes = 1;

0 rows in set. Elapsed: 0.007 sec. Processed 8.19 thousand rows, 65.54 KB
Peak memory usage: 5.46 KiB.
Only if we enable both index analysis cache and bit indexes, we will get the most performance out of this query:
SELECT UserID FROM hits WHERE UserID = 435090932899640449 FORMAT Null
SETTINGS use_index_analysis_cache = 1, use_bit_indexes = 1;

0 rows in set. Elapsed: 0.002 sec. Processed 8.19 thousand rows, 65.54 KB
Peak memory usage: 5.46 KiB.
ORDER BY late materialization
In queries like this:
SELECT * FROM hits WHERE URL LIKE '%google%' ORDER BY EventTime LIMIT 10;
ClickHouse has a very inefficient pipeline. It reads all columns, then all columns are filtered and sorted, and then LIMIT is applied. The problem is that in the query, we only need to work with two columns, URL and EventTime, but we had to read all columns, filter them, sort, and then apply LIMIT. This can be optimized by saving row identifiers for the URL and EventTime columns, executing query only for these columns, and then fetching other columns by row identifiers.
I saw that in ClickHouse, there was issue for possible implementation of this optimization. Such late materialization was implemented in this ClickHouse pull request and merged recently. But Ursa was checked out in December 2024, so I did not have such optimization.
In Ursa, I implemented this optimization in December 2024 in a different way on the query planning level. This way is simpler, but it is not as efficient as possible. Example query is transformed into something like this if presented in SQL:
SELECT * FROM hits WHERE (URL, EventTime)
IN (
  SELECT URL, EventTime FROM hits
  WHERE URL LIKE '%google%'
  ORDER BY EventTime LIMIT 10
) ORDER BY EventTime LIMIT 10;
Inner query SELECT URL, EventTime FROM hits WHERE URL LIKE '%google%' ORDER BY EventTime LIMIT 10 is executed first, and then results are inlined into the outer query. So, the second argument of the IN function is not a row set, but just 10 tuples. It is implemented like this to allow the efficient use of indexes.
Query performance in ClickHouse without lazy materialization:
SELECT * FROM hits WHERE URL LIKE '%google%'
ORDER BY EventTime LIMIT 10 FORMAT Null
SETTINGS query_plan_optimize_lazy_materialization = 0

0 rows in set. Elapsed: 2.550 sec. Processed 100.00 million rows, 21.89 GB
Peak memory usage: 1.22 GiB.
Query performance in ClickHouse with lazy materialization:
SELECT * FROM hits WHERE URL LIKE '%google%'
ORDER BY EventTime LIMIT 10 FORMAT Null
SETTINGS query_plan_optimize_lazy_materialization = 1

0 rows in set. Elapsed: 1.207 sec. Processed 100.00 million rows, 10.81 GB
Peak memory usage: 117.91 MiB.
Query performance in Ursa:
SELECT * FROM hits WHERE URL LIKE '%google%'
ORDER BY EventTime LIMIT 10 FORMAT Null;

0 rows in set. Elapsed: 0.379 sec. Processed 25.32 million rows, 4.19 GB
Peak memory usage: 120.91 MiB.
There is around a 4x speedup in Ursa for such a query. It is also interesting why Clickhouse implementation with query_plan_optimize_lazy_materialization = 1 is not that efficient, but I did not have time to investigate it yet.
Cache in heavy functions
When I checked the performance of such a query:
SELECT
  REGEXP_REPLACE(Referer, '^https?://(?:www\.)?([^/]+)/.*$', '\1') AS k,
  AVG(length(Referer)) AS l,
  COUNT(*) AS c,
  MIN(Referer)
FROM hits WHERE Referer <> '' GROUP BY k HAVING COUNT(*) > 100000
ORDER BY l DESC LIMIT 25;
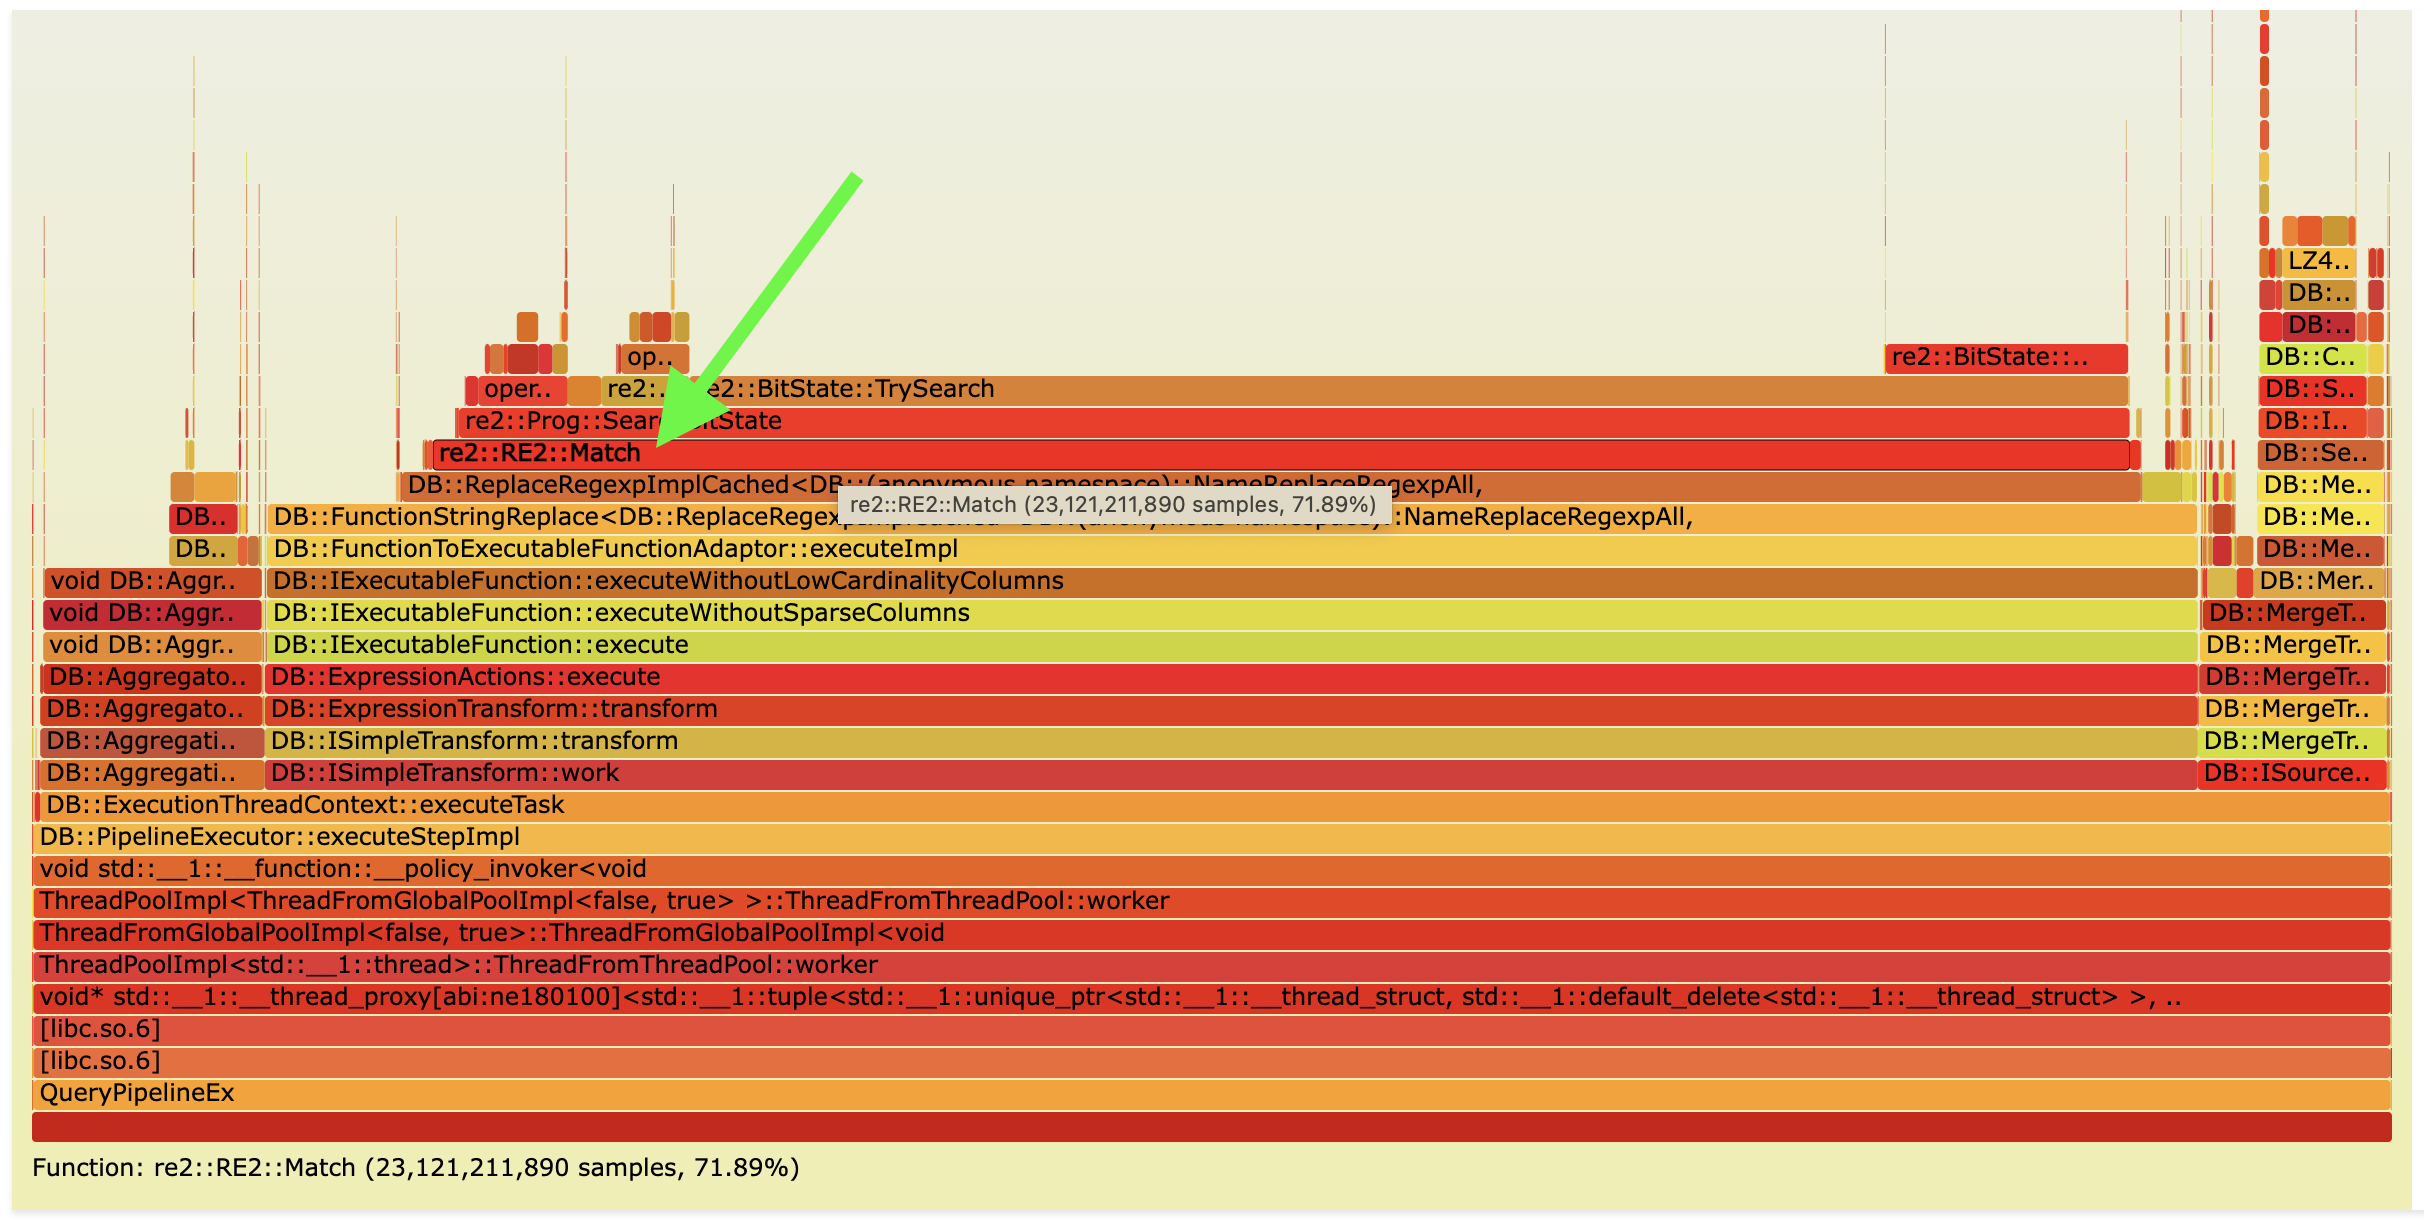
I thought that it was impossible to improve anything. Let’s look at a flame graph of this query:
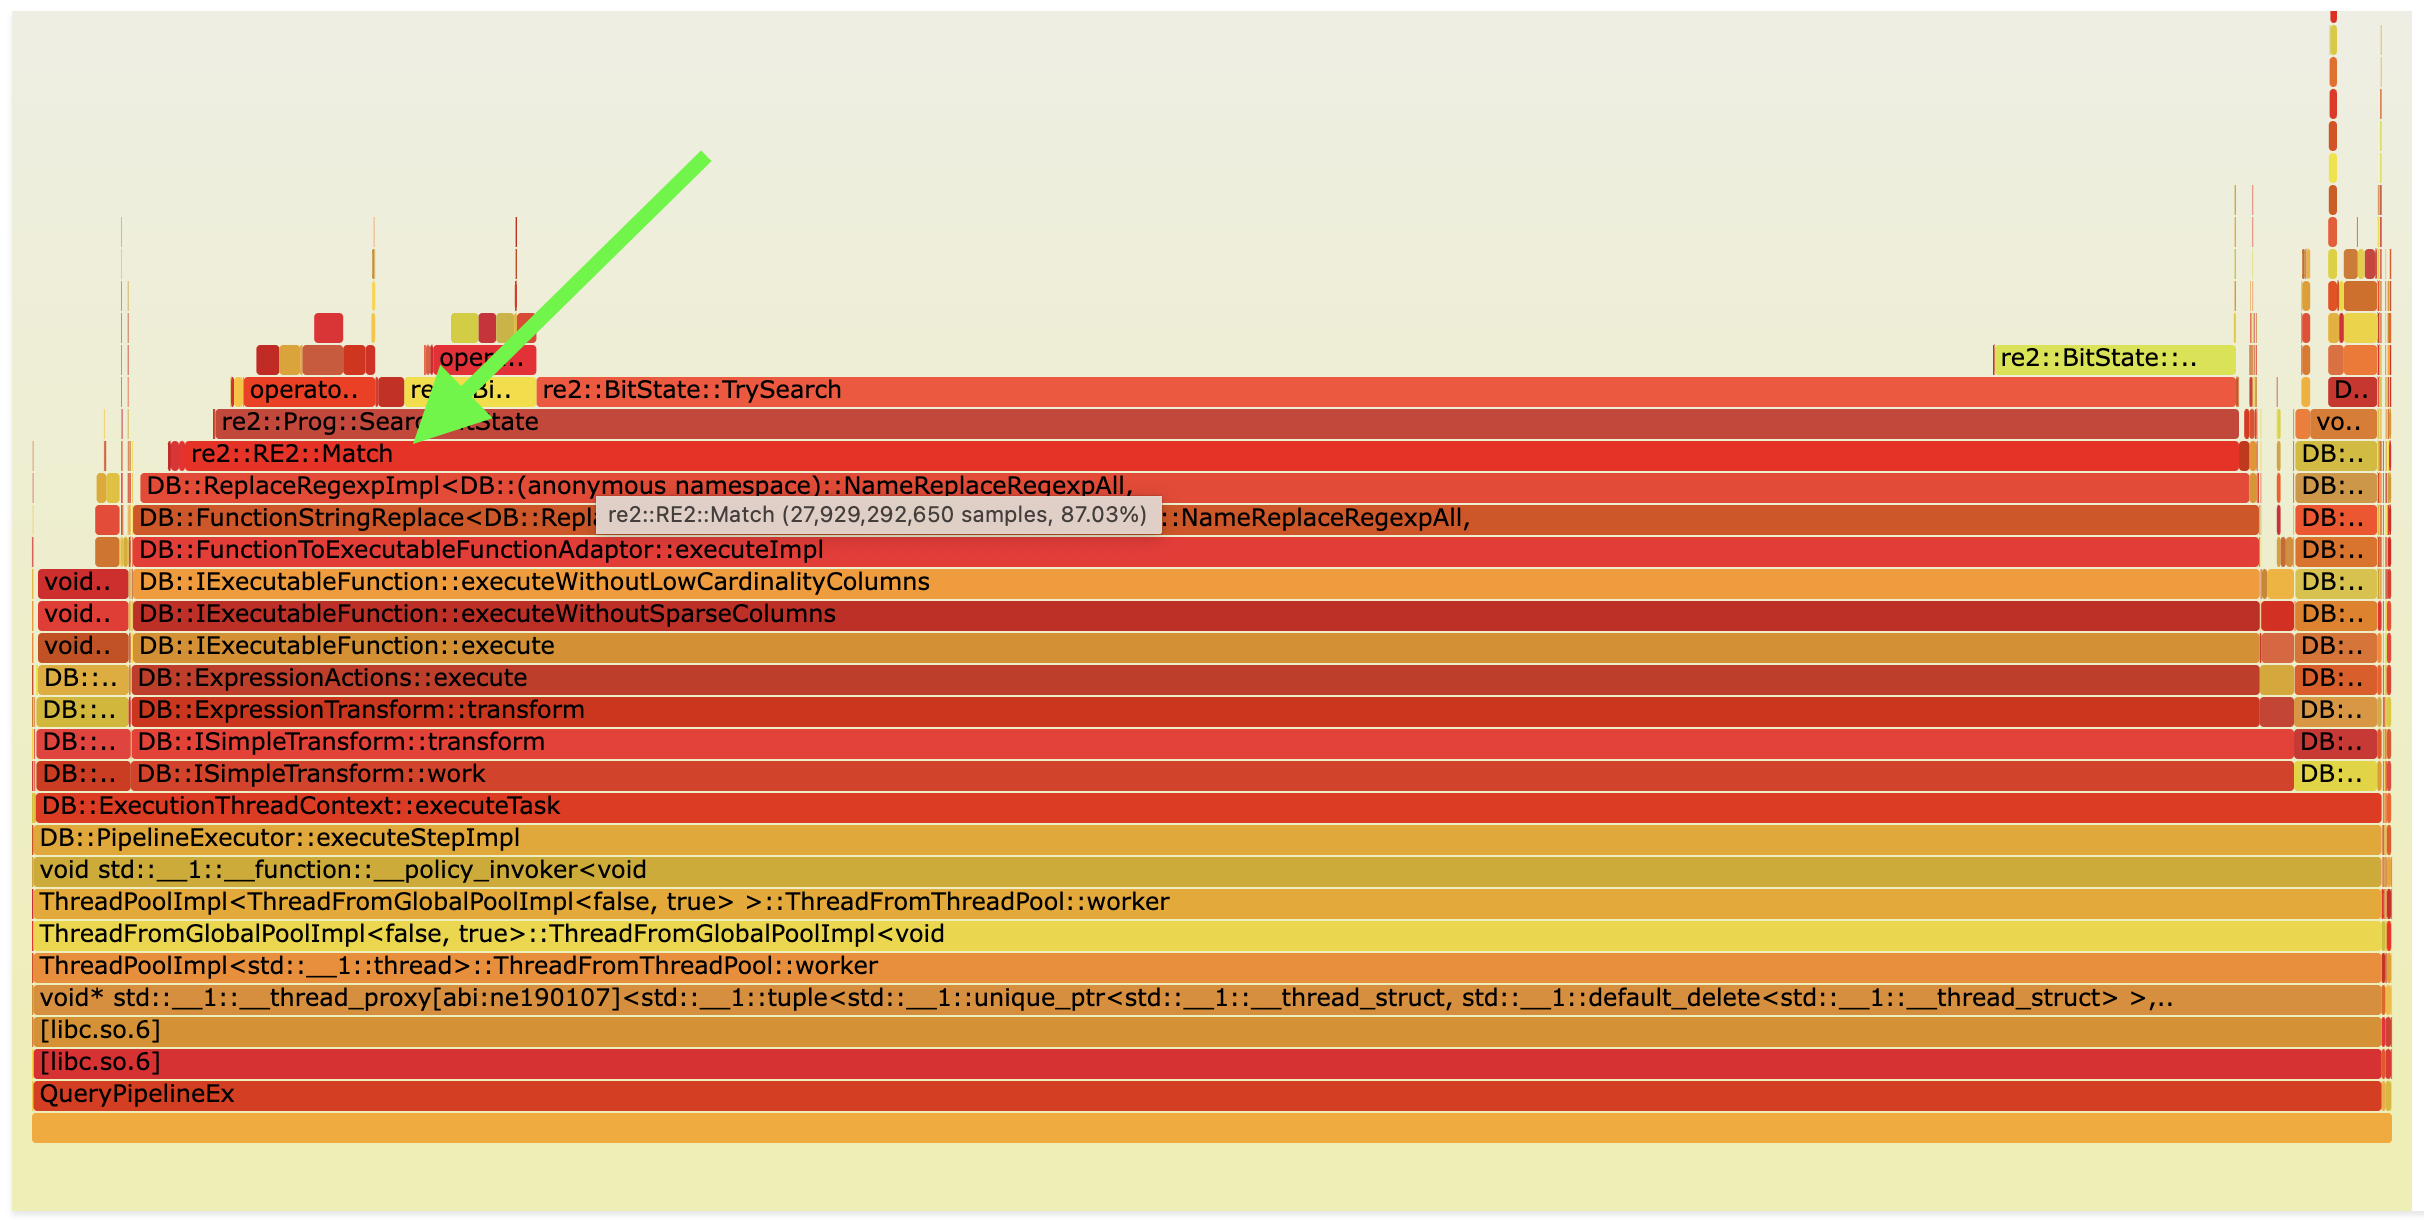
As you can see, we spend a lot of time in the REGEXP_REPLACE function, and this function just uses re2 regexp library. I could try to use some different regexp library, but I decided to understand more about the data we are working with. In this particular case, we are working with a column that contains a lot of duplicate values. It can be detected by statistics that are collected. In such a scenario for such heavy functions like REGEXP_REPLACE, it is possible to cache the results of this function in the hash table for values in the current block and then reuse it for other values inside the same block.
This optimization is implemented in Ursa.
Query performance in ClickHouse:
SELECT
  REGEXP_REPLACE(Referer, '^https?://(?:www\.)?([^/]+)/.*$', '\1') AS k,
  AVG(length(Referer)) AS l,
  COUNT(*) AS c,
  MIN(Referer)
FROM hits WHERE Referer <> '' GROUP BY k HAVING COUNT(*) > 100000
ORDER BY l DESC LIMIT 25 FORMAT Null;

0 rows in set. Elapsed: 9.035 sec. Processed 100.00 million rows, 7.56 GB
Peak memory usage: 2.08 GiB.
Query performance in Ursa:
SELECT
  REGEXP_REPLACE(Referer, '^https?://(?:www\.)?([^/]+)/.*$', '\1') AS k,
  AVG(length(Referer)) AS l,
  COUNT(*) AS c,
  MIN(Referer)
FROM hits
WHERE Referer <> '' GROUP BY k HAVING COUNT(*) > 100000
ORDER BY l DESC LIMIT 25 FORMAT Null;

0 rows in set. Elapsed: 5.016 sec. Processed 99.93 million rows, 7.56 GB
Peak memory usage: 2.50 GiB.
There is around 45% speedup in Ursa for such a query.
Flame graph of this query in Ursa after optimization:
Other optimizations
Additionally, I implemented a ton of small optimizations and improvements here and there that were found during performance analysis. Some of them are:
-
Improve merge performance using
BatchHeap. This is my old pull request that I finished in Ursa. -
Performance improvements of the
IColumn::scattermethod. -
Improvement of such query
SELECT COUNT(*) FROM hits WHERE AdvEngineID <> 0;using default values statistics.
Query performance in ClickHouse:
SELECT COUNT(*) FROM hits WHERE AdvEngineID <> 0 FORMAT Null

0 rows in set. Elapsed: 0.007 sec. Processed 100.00 million rows, 6.32 MB
Peak memory usage: 150.41 KiB.
Query performance in Ursa:
SELECT COUNT(*) FROM hits WHERE AdvEngineID <> 0 FORMAT Null

0 rows in set. Elapsed: 0.001 sec.
Around 7x speedup in Ursa for such a query.
Improvements that did not work
Here, I wanted to describe some optimizations that I tried to implement, but as a result, they did not give any performance improvements. It is still possible that some of them are valid if attacked from different angles:
-
I tried to configure
jemallocaccording to their tuning guide. It did not lead to any performance improvements. -
I tried to change
IColumninterface to support batch deserialization of data after aggregation. I tried it a while ago in this pull request, and I did not see any performance improvements at that time. In Ursa I also was not able to optimize this place with this optimization. This place can be optimized, but it probably requires more work. -
I designed and implemented another
MergeTreereader that has less lock contention. I did not see any performance improvements. Maybe on a machine likec6a.metalwith more cores, it will eventually shine. -
I tried to optimize
uniqExactaggregate function. It is possible to optimize it with the preallocation of hash tables using statistics. But in this particular case, it was quite complex to push statistics information touniqExactfunction.
Future potential improvements
Statistics
In ClickHouse, currently, no offline statistics are collected by default. Some runtime statistics are collected, for example, to preallocate hash tables in GROUP BY and JOIN operators. However, it is still not enough to make good decisions on the query planning level for a lot of optimizations.
Also, during query execution, statistics can be very beneficial for prefiltering data for some queries or dispatch between different execution strategies.
This is the number one thing that I would like to improve in Ursa/ClickHouse because it will open doors to a lot of other interesting optimizations that require careful analysis and statistics.
Runtime indexes
During the development of Ursa, I thought a lot about runtime indexes. Runtime bit indexes are the first simple implementation of this idea. In theory, you can cache results of selective Filters, Sorting + Limit, and Aggregation (in case of low cardinality aggregation) directly inside parts. This is similar to ClickHouse projections feature, but it is implemented in runtime. Such indexes can be stored in memory or on disk. This can be combined with stored and runtime collected statistics to understand if the creation of such runtime indexes (projections) can be beneficial.
Even if we understand that it is beneficial to create such indexes in runtime using statistics, this can be challenging to implement in ClickHouse. Currently, in ClickHouse, data is processed in blocks, which you can read from any part. So, if you just decide to execute a query separately for each part and then save runtime indexes per part, this will lead to huge performance degradation because you will have less parallel execution, and you will need to duplicate a lot of work to merge results of query execution for each part.
It is possible to do it very carefully and execute query separately for some parts if such parts are big enough and we can guarantee good parallelization of reading. Another approach is to just build such runtime indexes in the background after multiple queries with the same operators are executed, similar to JIT compilation. Maybe it is better to call such indexes just-in-time indexes?
I prefer the second approach because it is easier to implement safely and later move to the first approach.
Executor
During the development of Ursa, I also noticed that for a lot of queries, there is a noticeable CPU underutilization of around 15%-30%. It can be seen as swapper in flame graphs or using mpstat. My hypothesis is that the problem is in the executor because when I implemented partitioned GROUP BY, for some queries, the problem was even more noticeable because processors are highly interconnected in the result pipeline. I tried to debug it using additional metrics:
M(ExecutingGraphNodeStatusMutexLock, "Number of times the lock of ExecutingGraph::NodeStatus was acquired or tried to acquire.", ValueType::Number) \
M(ExecutingGraphNodeStatusMutexLockWaitMicroseconds, "ExecutingGraph::NodeStatus lock wait time in microseconds", ValueType::Microseconds) \
\
M(ExecutingGraphLock, "Number of times the lock of ExecutingGraph was acquired or tried to acquire.", ValueType::Number) \
M(ExecutingGraphLockWaitMicroseconds, "ExecutingGraph lock wait time in microseconds", ValueType::Microseconds) \
\
M(ExecutorTaskLock, "Number of times the lock of ExecutorTask was acquired or tried to acquire.", ValueType::Number) \
M(ExecutorTaskLockWaitMicroseconds, "ExecutorTask lock wait time in microseconds", ValueType::Microseconds) \
and also using internal DEBUG_PIPELINE_EXECUTOR = 1 flag. It is still unclear to me if the problem is directly in the executor or in some other place because it was pretty hard to debug and find the root cause.
As a result, I still think that this is a potential place for improvements in the future.
Conclusion
My end goal has not yet been achieved. I want Ursa/ClickHouse to be the fastest general-purpose analytical database in the world. I want to see Ursa in the top 1 for ClickBench in cold/hot run.
In the next Ursa versions, I will try to implement some other optimizations that I wanted to implement in the first version but did not have enough time. I will also try to implement something from the list of potential future improvements.
I will continue to develop and improve paw tool for benchmarking and performance analysis. Currently, it is still in the early development stage. Not all features that I need are implemented.