ARM CRC library
Maksim, developer of YDB.
https://maksimkita.com/1. ARM optimization basics.
2. Benchmarks.
3. ClickBench.
4. YCSB.
5. TPC-C.
Main infrastructure problems:
1. Low-level libraries do not always have ARM support.
2. Low-level libraries are not optimized for ARM. Examples: compression/decompression libraries (lz4, zstd), hashes.
3. Tools are not optimized (objdump, perf).
4. Compilers generate less efficient code (gcc, clang). ARM backends have less platform specific optimizations.
Main implementation problems:
1. Different costs (virtual function call, atomics, read/write unaligned memory, etc.).
2. Neon is not SSE4.2, AVX2, AVX512. Example: No pmovmskb instruction. Libraries that convert Neon to X86-64 SIMD are not efficient.
3. A lot of platform dependend code (X86-64).
https://github.com/aws/aws-graviton-getting-started/blob/main/perfrunbook/graviton_perfrunbook.md
ARM is weakly ordered, similar to POWER and other modern architectures. While x86 is a variant of total-store-ordering (TSO).
Code that relies on TSO may lack barriers to properly order memory references.
ARMv8 based systems are weakly ordered multi-copy-atomic.
LSE (Large System Extensions).
Enabled with -moutline-atomics compile flag to detect and use in runtime. Introduces run-time dispatch overhead.
Can be enabled without run-time dispatch with -march=armv8.2-a.
Supported by Graviton 2, Kunpeng 920-4826 and all recent ARM CPUs.
https://learn.arm.com/learning-paths/servers-and-cloud-computing/lse/intro/
LSE introduces a set of atomic instructions:
1. Compare and Swap instructions: CAS and CASP
2. Atomic memory operation instructions: LD<op> and ST<op>, where <op> is one of ADD, CLR, EOR, SET, SMAX, SMIN, UMAX, and UMIN
3. Swap instruction: SWP
In architecture versions prior to LSE, read-modify-write sequences use load exclusive and store exclusive instructions.
Incrementing a shared variable uses a sequence such as:
1. LDXR to read current count (load exclusive).
2. ADD to add one to the shared variable.
3. STXR to attempt to store to memory (store exclusive).
4. CMP to check if the operation succeeded.
bool simpleCAS(std::atomic<int64_t> value,
    int64_t old_value,
    int64_t new_value)
{
    return value.compare_exchange_strong(old_value, new_value);
}
Loop inside CAS:
0000000000400690 <_Z9simpleCASSt6atomicIlEll>:
 400690:	c85ffc03 	ldaxr	x3, [x0]
 400694:	eb01007f 	cmp	x3, x1
 400698:	54000061 	b.ne	4006a4
 40069c:	c804fc02 	stlxr	w4, x2, [x0]
 4006a0:	35ffff84 	cbnz	w4, 400690
 4006a4:	1a9f17e0 	cset	w0, eq
 4006a8:	d65f03c0 	ret
 4006ac:	d503201f 	nop
No loop inside CAS:
0000000000400690 <_Z9simpleCASSt6atomicIlEll>:
 400690:	aa0103e3 	mov	x3, x1
 400694:	c8e3fc02 	casal	x3, x2, [x0]
 400698:	eb01007f 	cmp	x3, x1
 40069c:	1a9f17e0 	cset	w0, eq
 4006a0:	d65f03c0 	ret
class SpinLock
{
public:
    void lock()
    {
        while (true)
        {
            if (!lock_.exchange(true, std::memory_order_acq_rel))
                break;

            while (lock_.load(std::memory_order_relaxed))
                pauseYield();
        }
    }

    void unlock()
    {
        lock_.store(false, std::memory_order_release);
    }
private:
    std::atomic<bool> lock_;
};
0000000000400690 <_ZN8SpinLock4lockEv>:
  400690:	52800022 	mov	w2, #0x1
  400694:	d503201f 	nop
  400698:	085ffc01 	ldaxrb	w1, [x0]
  40069c:	0803fc02 	stlxrb	w3, w2, [x0]
  4006a0:	35ffffc3 	cbnz	w3, 400698
  4006a4:	72001c3f 	tst	w1, #0xff
  4006a8:	540000c0 	b.eq	4006c0
  4006ac:	39400001 	ldrb	w1, [x0]
  4006b0:	72001c3f 	tst	w1, #0xff
  4006b4:	54ffff20 	b.eq	400698
  4006b8:	d503203f 	yield
  4006bc:	17fffffc 	b	4006ac
  4006c0:	d65f03c0 	ret
  4006c4:	d503201f 	nop
  4006c8:	d503201f 	nop

00000000004006d0 <_ZN8SpinLock6unlockEv>:
  4006d0:	089ffc1f 	stlrb	wzr, [x0]
  4006d4:	d65f03c0 	ret
0000000000400690 <_ZN8SpinLock4lockEv>:
  400690:	52800022 	mov	w2, #0x1
  400694:	d503201f 	nop
  400698:	38e28001 	swpalb	w2, w1, [x0]
  40069c:	72001c3f 	tst	w1, #0xff
  4006a0:	540000e0 	b.eq	4006bc
  4006a4:	d503201f 	nop
  4006a8:	39400001 	ldrb	w1, [x0]
  4006ac:	72001c3f 	tst	w1, #0xff
  4006b0:	54ffff40 	b.eq	400698
  4006b4:	d503203f 	yield
  4006b8:	17fffffc 	b	4006a8
  4006bc:	d65f03c0 	ret

00000000004006c0 <_ZN8SpinLock6unlockEv>:
  4006c0:	089ffc1f 	stlrb	wzr, [x0]
  4006c4:	d65f03c0 	ret
Run simple benchmark to measure lock, unlock performance for 16 threads.
Without LSE: 9250 ms.
With LSE: 3114 ms.
Almost does not matter on X86-64. Matters a lot on ARM.
1. sequential-consistency
2. acquire/release
3. relaxed
In old libraries can be a lot of suboptimal implementation of synchronization primitives, spinlocks, custom lock-free data structures, memory barriers.
Probably contain a lot of bugs on ARM, because was tested only on X86-64.
Very hard to maintain, modify.
All new code need to use std::atomic and build synchronization primitives on top of it.
Platform dependend paddings:
alignas(64) std::atomic<uint64_t> state;
char padding[64 - sizeof(state)];
Can be replaced with:
alignas(hardware_destructive_interference_size) std::atomic<uint64_t> state;
char padding[hardware_destructive_interference_size - sizeof(state)];
https://en.cppreference.com/w/cpp/thread/hardware_destructive_interference_size
1. Autovectorization. Preferred option.
2. Manual SIMD instructions using intrinsics or assembly.
X86-64 intrinsics usage header examples:
#include <immintrin.h>
#include <emmintrin.h>
Special libraries can help with X86-64 intrinsics rewritting:
A lot of platform dependend code (X86-64).
#if defined(__x86_64__)

#ifdef __SSE2__

#if defined(__AVX__) || defined(__AVX2__)

#ifdef __BMI__
Add special branches for ARM (AARCH64):
#if defined(__aarch64__)
For SIMD intrinsics:
#if defined(__ARM_NEON)
#include <arm_neon.h>
#endif
SELECT COUNT(*) FROM hits;
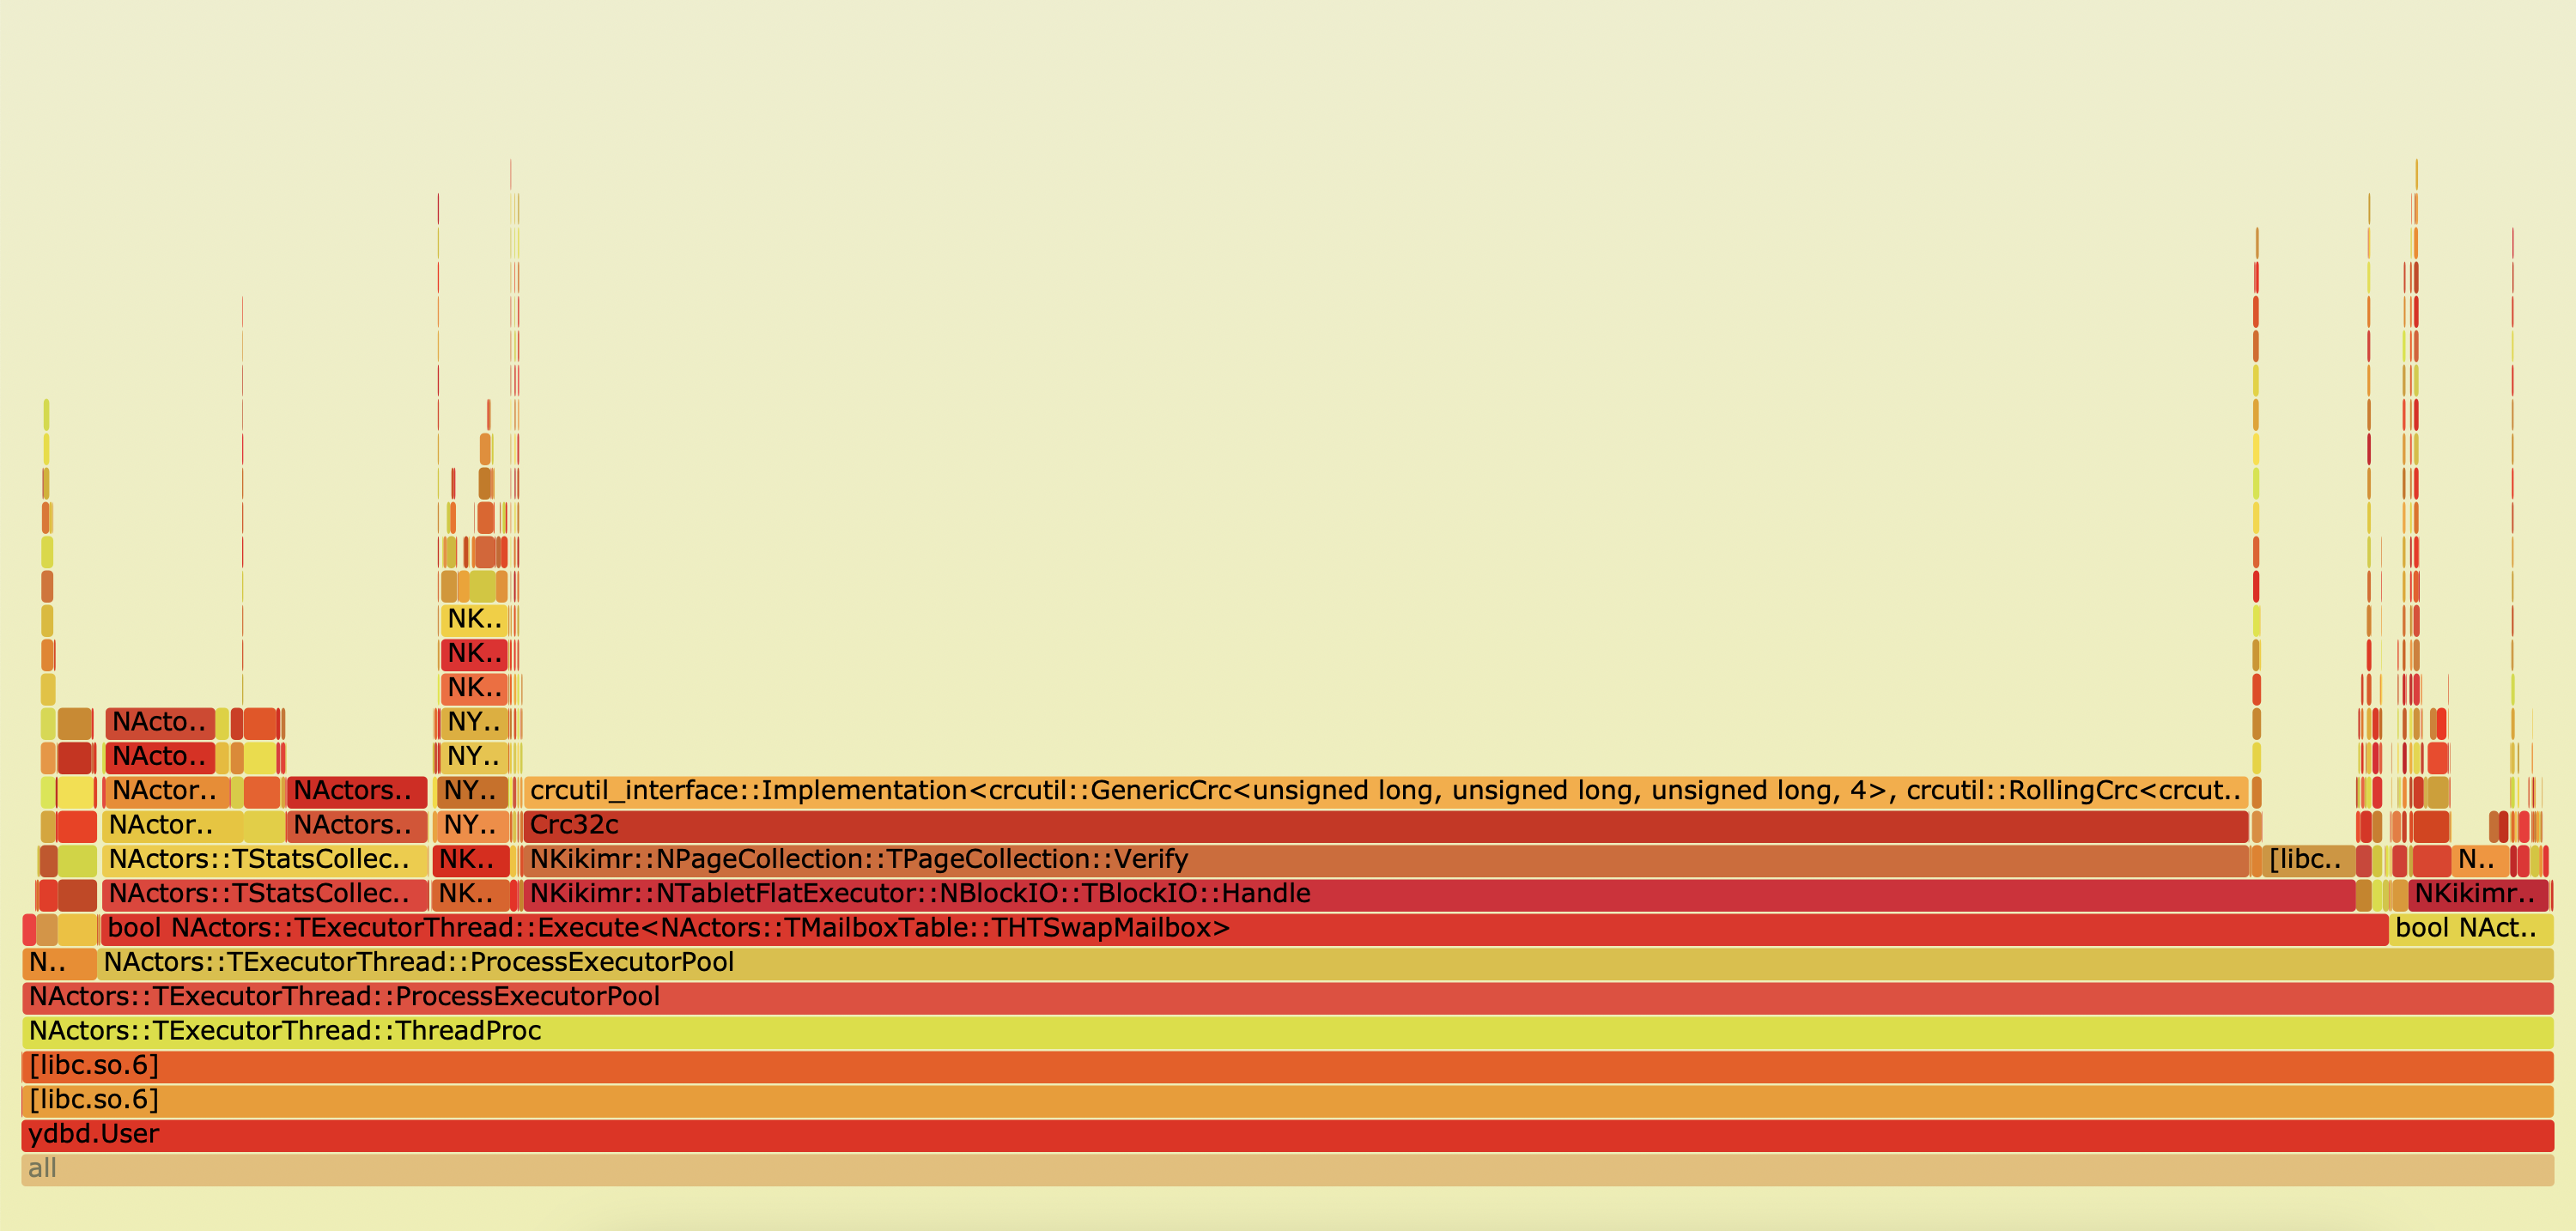
Perf top output:
Samples: 1M of event 'cycles:P', 4000 Hz, Event count (approx.): 165205540299 lost: 0/0 drop: 0/588582
Overhead  Shared Object            Symbol
  29,19%  ydbd                     [.] crcutil_interface::Implementation<crcutil::GenericCrc>
   9,03%  ydbd                     [.] ChaCha::Encipher
   6,20%  ydbd                     [.] NActors::TExecutorThreadStats::Aggregate
   2,79%  [kernel]                 [k] __arch_copy_to_user
   2,66%  ydbd                     [.] t1ha1_le
   2,07%  [kernel]                 [k] finish_task_switch
   2,00%  [kernel]                 [k] __arch_copy_from_user
   1,75%  ydbd                     [.] NActors::TBasicExecutorPool::GoToSpin
   1,48%  ydbd                     [.] NKikimr::NTable::NPage::TDataPageRecord
   1,46%  ydbd                     [.] TTcpPacketOutTask::Finish
   1,23%  ydbd                     [.] XXH_INLINE_XXH3_64bits_update
   0,96%  [kernel]                 [k] try_to_wake_up
   0,68%  libc.so.6                [.] 0x0000000000098fc0
   0,65%  ydbd                     [.] NActors::TBasicExecutorPool::GetReadyActivation
   0,58%  libc.so.6                [.] 0x0000000000098fcc
   0,57%  libc.so.6                [.] 0x0000000000098fbc
   0,52%  libc.so.6                [.] 0x0000000000098fc4
Problem was invalid architecture dispatch inside CRC library.
For ARM CRC library dispatched into the most inneficient implementation.
Perf top output:
Samples: 801K of event 'cycles:P', 4000 Hz, Event count (approx.): 109659260334 lost: 0/0 drop: 0/569470
Overhead  Shared Object            Symbol
  11,40%  ydbd                 [.] ChaCha::Encipher
   8,15%  ydbd                 [.] NActors::TExecutorThreadStats::Aggregate
   5,10%  ydbd                 [.] crcutil::GenericCrc
   2,82%  [kernel]             [k] __arch_copy_to_user
   2,68%  ydbd                 [.] NKikimr::NTable::NPage::TDataPageRecord
   2,36%  ydbd                 [.] t1ha1_le
   2,26%  [kernel]             [k] finish_task_switch
   2,00%  ydbd                 [.] NActors::TBasicExecutorPool::GoToSpin
   1,75%  ydbd                 [.] TTcpPacketOutTask::Finish
   1,56%  ydbd                 [.] XXH_INLINE_XXH3_64bits_update
   1,39%  [kernel]             [k] __arch_copy_from_user
   1,28%  libc.so.6            [.] 0x0000000000098fc0
   1,24%  ydbd                 [.] NKikimr::NTable::TPartSimpleIt::Apply
   1,23%  ydbd                 [.] NKikimr::TPinnedPageRef::TPinnedPageRef
   1,13%  perf                 [.] rb_next
   1,03%  [kernel]             [k] try_to_wake_up
   0,98%  libc.so.6            [.] 0x0000000000098fbc
   0,98%  ydbd                 [.] NActors::TBasicExecutorPool::GetReadyActivation
Around 20% reduce of CPU usage.
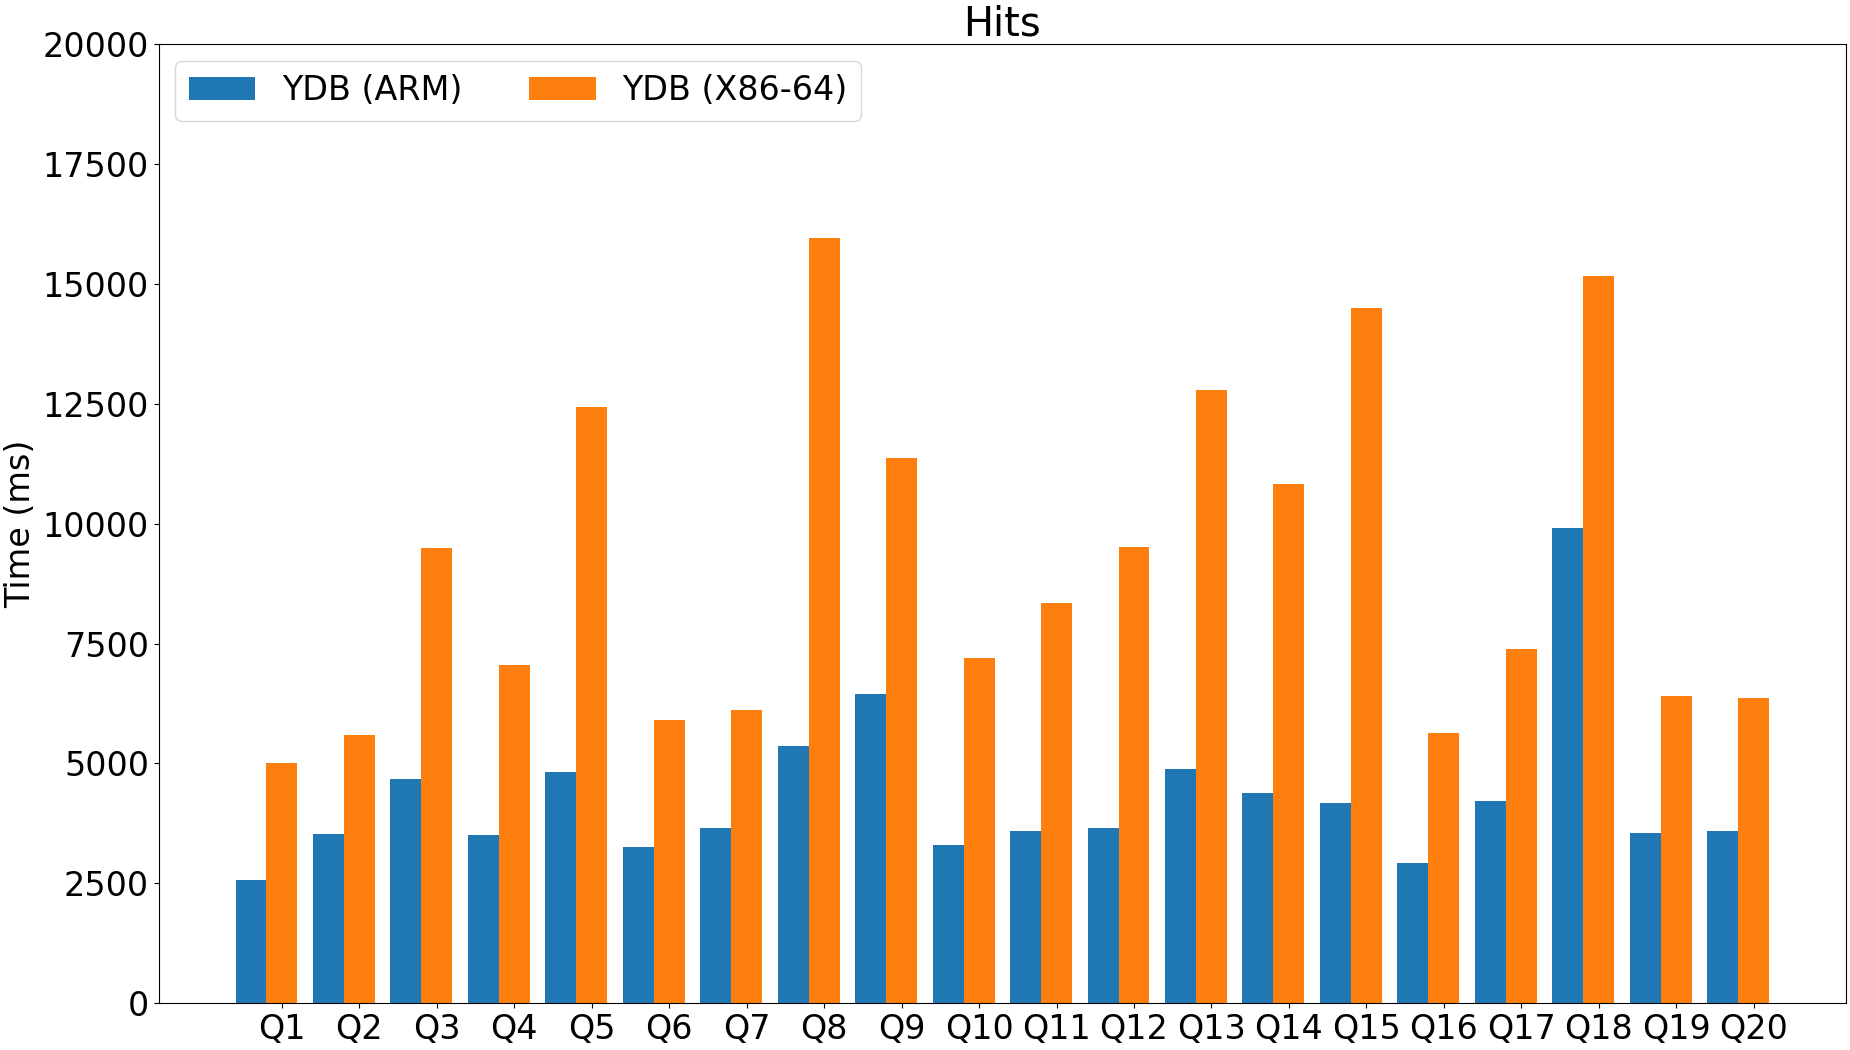
For queries after fix there is 10% - 20% performance improvement:
SELECT COUNT(*) FROM hits;
Was: 3091 ms
Now: 2575 ms
9 nodes
CPU: 2 x Kunpeng 920-4826 (2 x 48 = 96 physical cores).
RAM: 502GB.
Disk: SSD SAMSUNG MZ7LH960 (Sequential write around 500 MB/s, read around 500 MB/s).
9 nodes
CPU: 2 x Intel(R) Xeon(R) Gold 6126 (2 x 12 = 24 physical cores, 24 * 2 = 48 virtual cores with hyper-threading).
RAM: 375GB.
Disk: SSD SDLF1CRM016T-1HH.
Benchmarks:
1. ClickBench.
2. YCSB.
3. TPC-C.
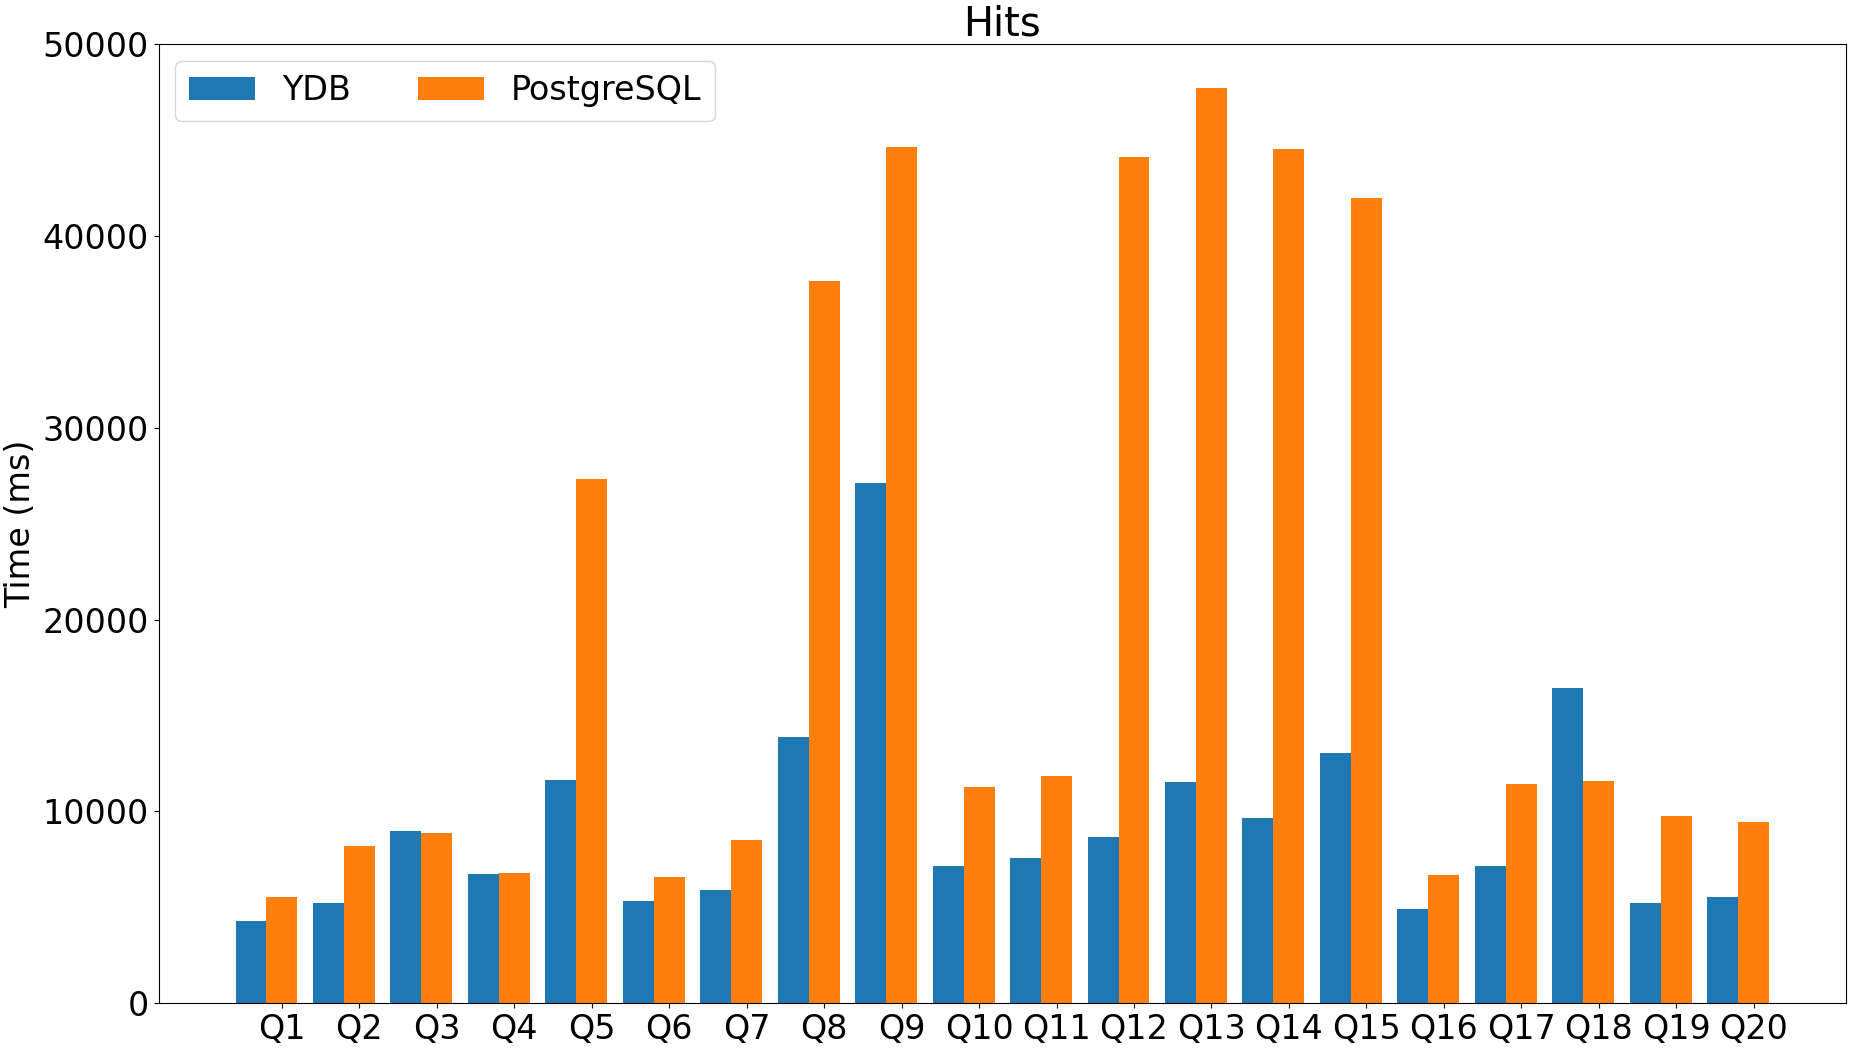
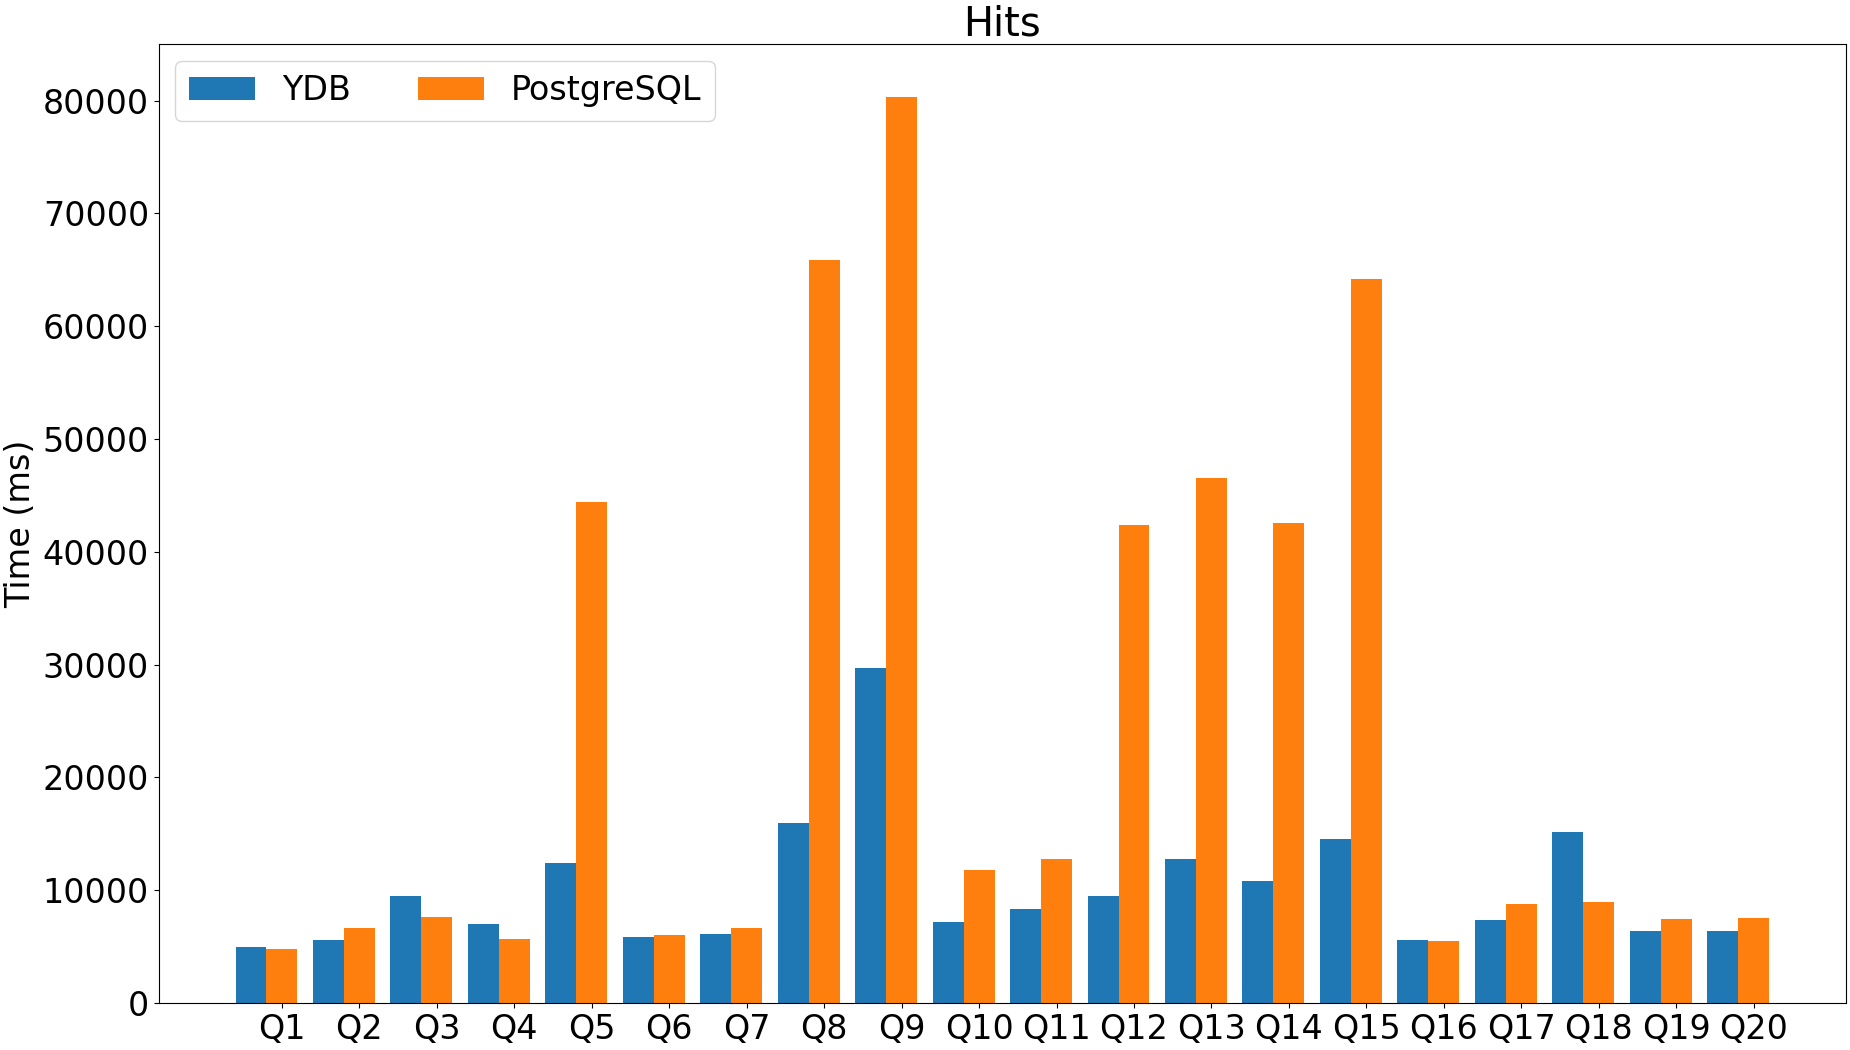
ClickBench https://github.com/ClickHouse/ClickBench
Data is based on obfuscated data from Yandex.Metrica production.
Dataset contains 100m rows, 70GB uncompressed data.
Queries mostly analytical, but some contain unindexed key lookups:
SELECT UserID FROM hits WHERE UserID = 435090932899640449;
Main goal is to utilize and stress test system under pressure, to find some hotspots that can be optimized.
ARM data single machine upload time:
YDB row storage - 911 seconds (15 min)
Postgres - 1450 seconds (24 min)
X86-64 data single machine upload time:
YDB row storage - 1298 seconds (22 min)
Postgres - 1730 seconds (30 min)
YDB configuration: 1 storage node, 4 dynamic nodes (standard configuration for large servers). All nodes are on single physical machine.
PostgreSQL configuration: optimized version for ClickBench https://github.com/ClickHouse/ClickBench/tree/main/postgresql-tuned (number of workers and buffers sizes increased to fully match machine capabilities).
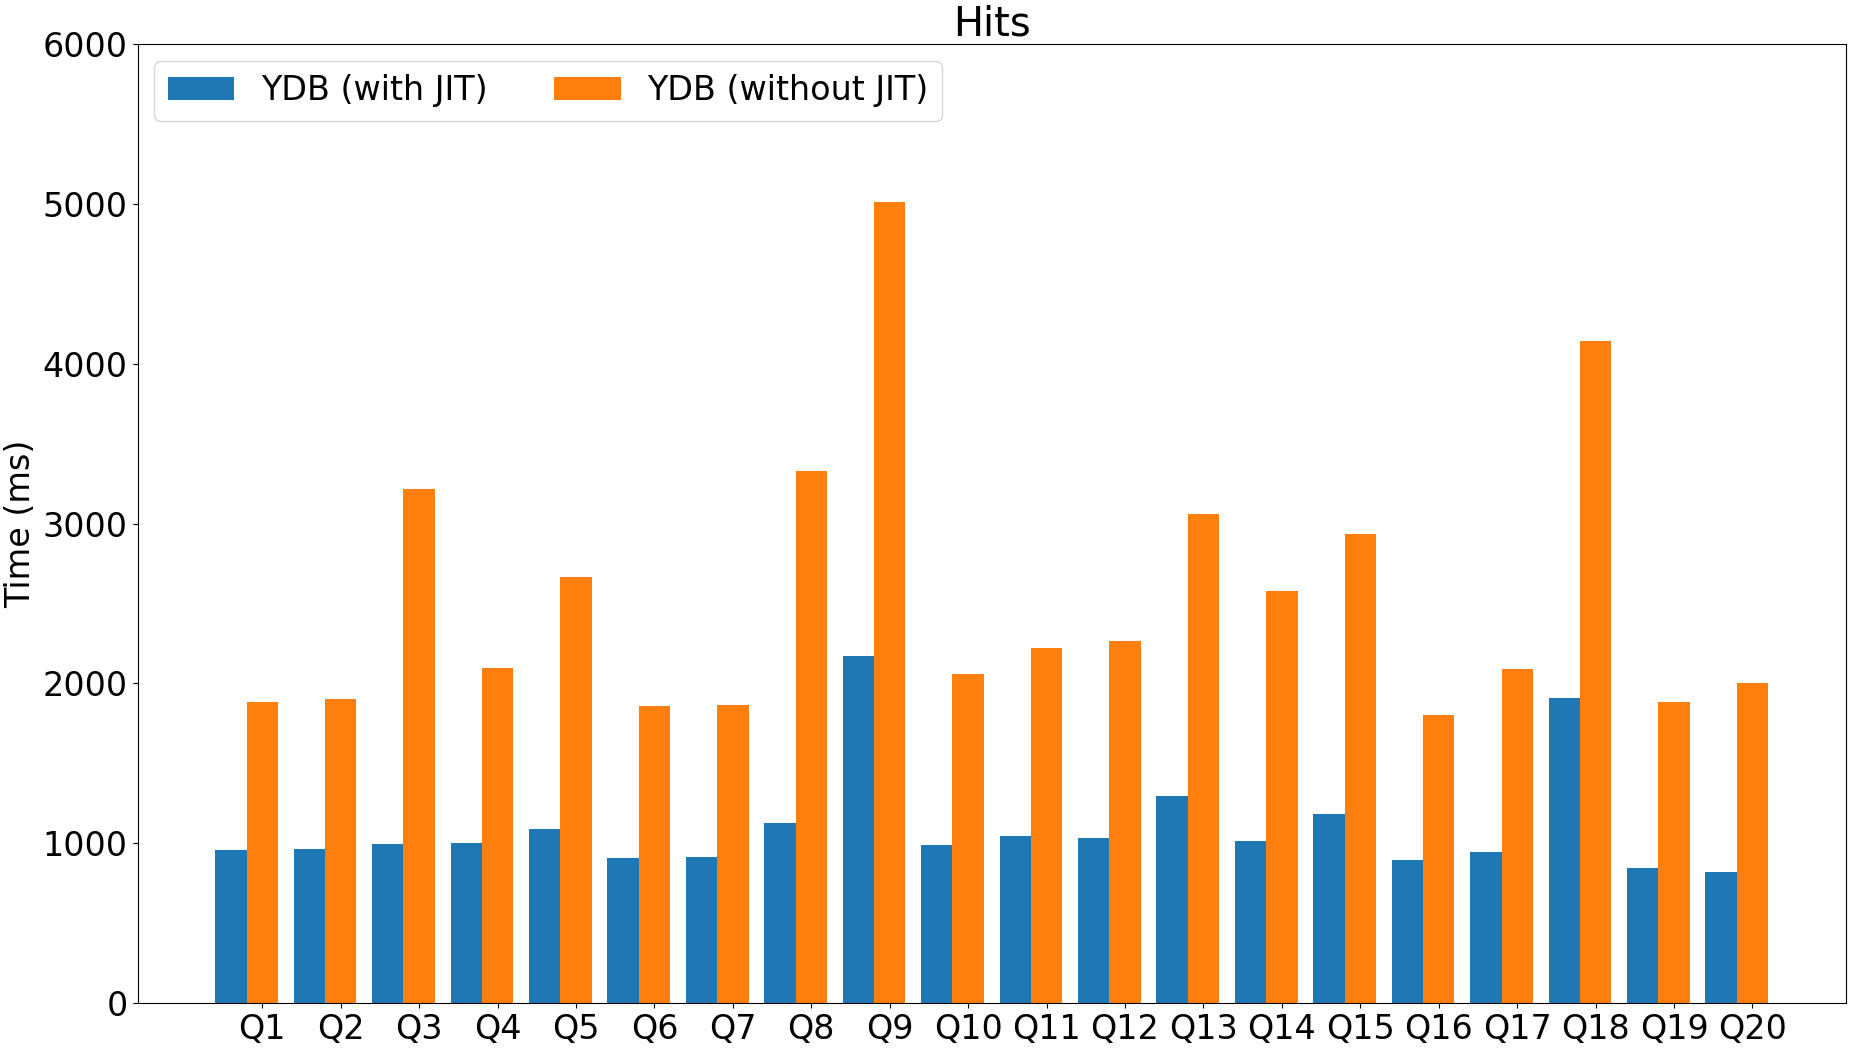
JIT can provide a lot of performance improvements for analytical workloads (2x - 29x performance improvement).
Currently available only for X86-64.
table_service_config:
    enable_async_computation_pattern_compilation: true
SELECT SUM(ResolutionWidth), SUM(ResolutionWidth + 1),
    SUM(ResolutionWidth + 2), SUM(ResolutionWidth + 3),
    SUM(ResolutionWidth + 4), SUM(ResolutionWidth + 5),
    SUM(ResolutionWidth + 6), SUM(ResolutionWidth + 7),
    SUM(ResolutionWidth + 8), SUM(ResolutionWidth + 9),
    SUM(ResolutionWidth + 10), SUM(ResolutionWidth + 11),
    SUM(ResolutionWidth + 12), SUM(ResolutionWidth + 13),
    SUM(ResolutionWidth + 14), SUM(ResolutionWidth + 15),
    ...
    SUM(ResolutionWidth + 87), SUM(ResolutionWidth + 88),
    SUM(ResolutionWidth + 89) FROM hits;
Before (without JIT): 56.1 seconds.
After (with JIT): 1.9 seconds.
Overall ARM is faster in 2-2.5 times.
Yahoo! Cloud Serving Benchmark.
Several different key-value workloads.
Each workload can be parameterized using record count, threads and target queries for each thread.
Zipfian distribution.
https://github.com/brianfrankcooper/YCSB
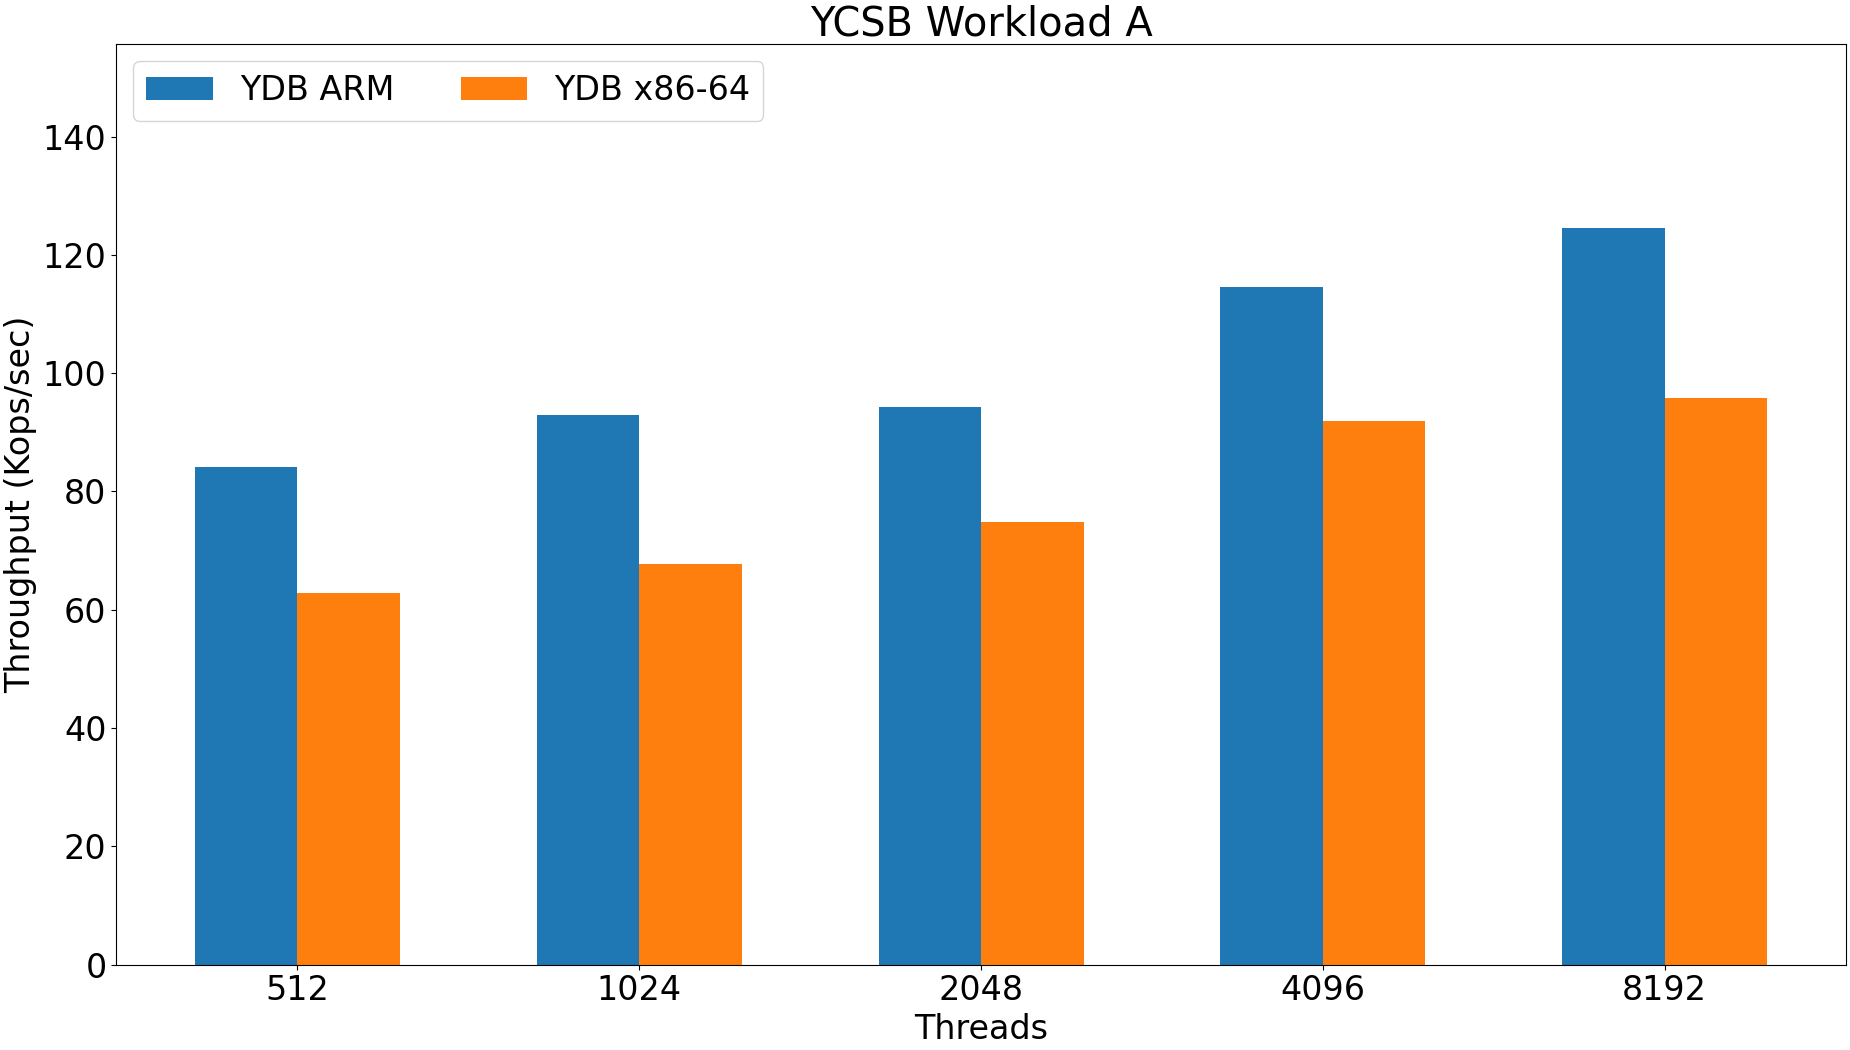
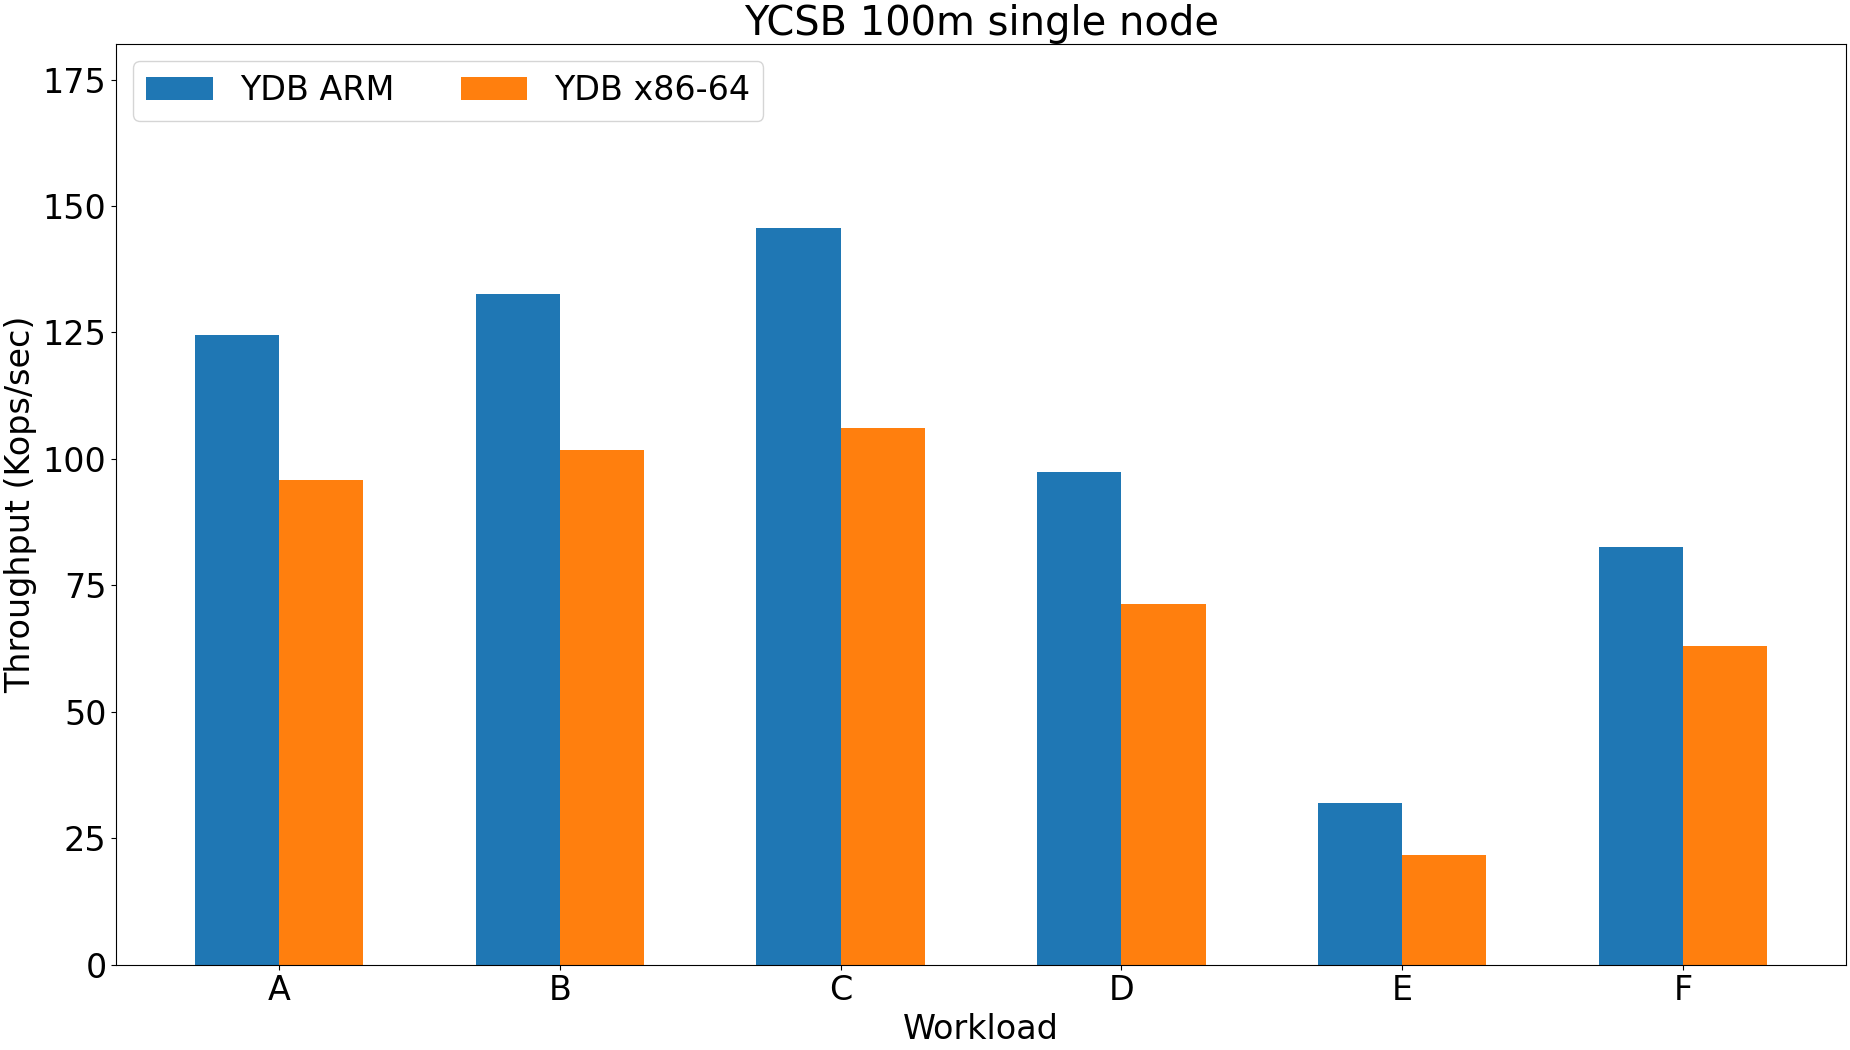
Workload A: Update heavy workload (50/50 reads/writes).
Workload B: Read mostly workload (95/5 reads/writes).
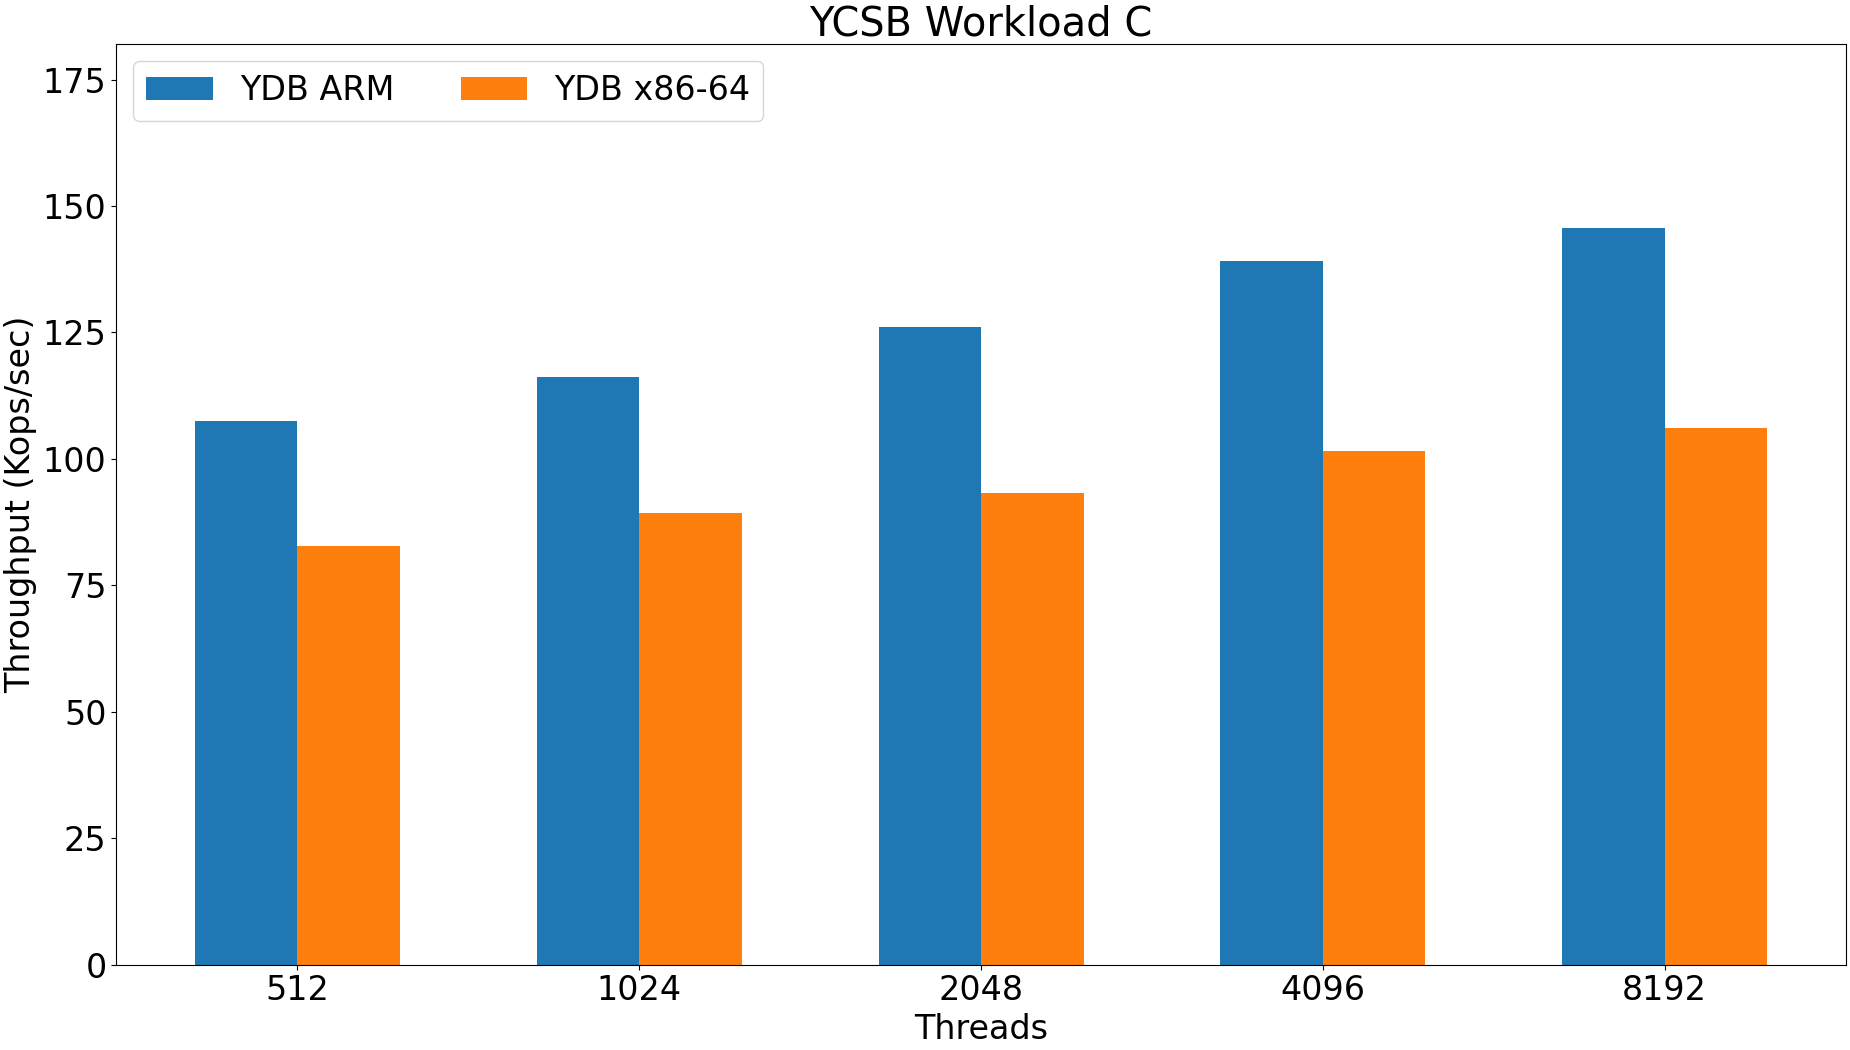
Workload C: Read only.
Workload D: Read latest (insert new record and read inserted).
Workload E: Read ranges.
Workload F: Read-modify-write (read record modify it and write).
Datasets: 100M (100 GB), 300M (300 Gb).
Workloads: A, B, C, D, E, F.
Threads: 512, 1024, 2048, 4096, 8192.
ARM upload time 100m: 2569 seconds.
X86-64 upload time 100m: 3725 seconds.
ARM is 50% faster.
ydb -p test_db_cluster scheme describe usertable
--stats --partition-stats --permissions
Table stats:
Partitions count: 80
Approximate number of rows: 100000000
Approximate size of table: 106.14 Gb
ARM upload time 300m: 4991 seconds.
X86-64 upload time 300m: 6285 seconds.
ARM is 25% faster.
ydb -p test_db_cluster scheme describe usertable
--stats --partition-stats --permissions
Table stats:
Partitions count: 229
Approximate number of rows: 300000400
Approximate size of table: 318.61 Gb
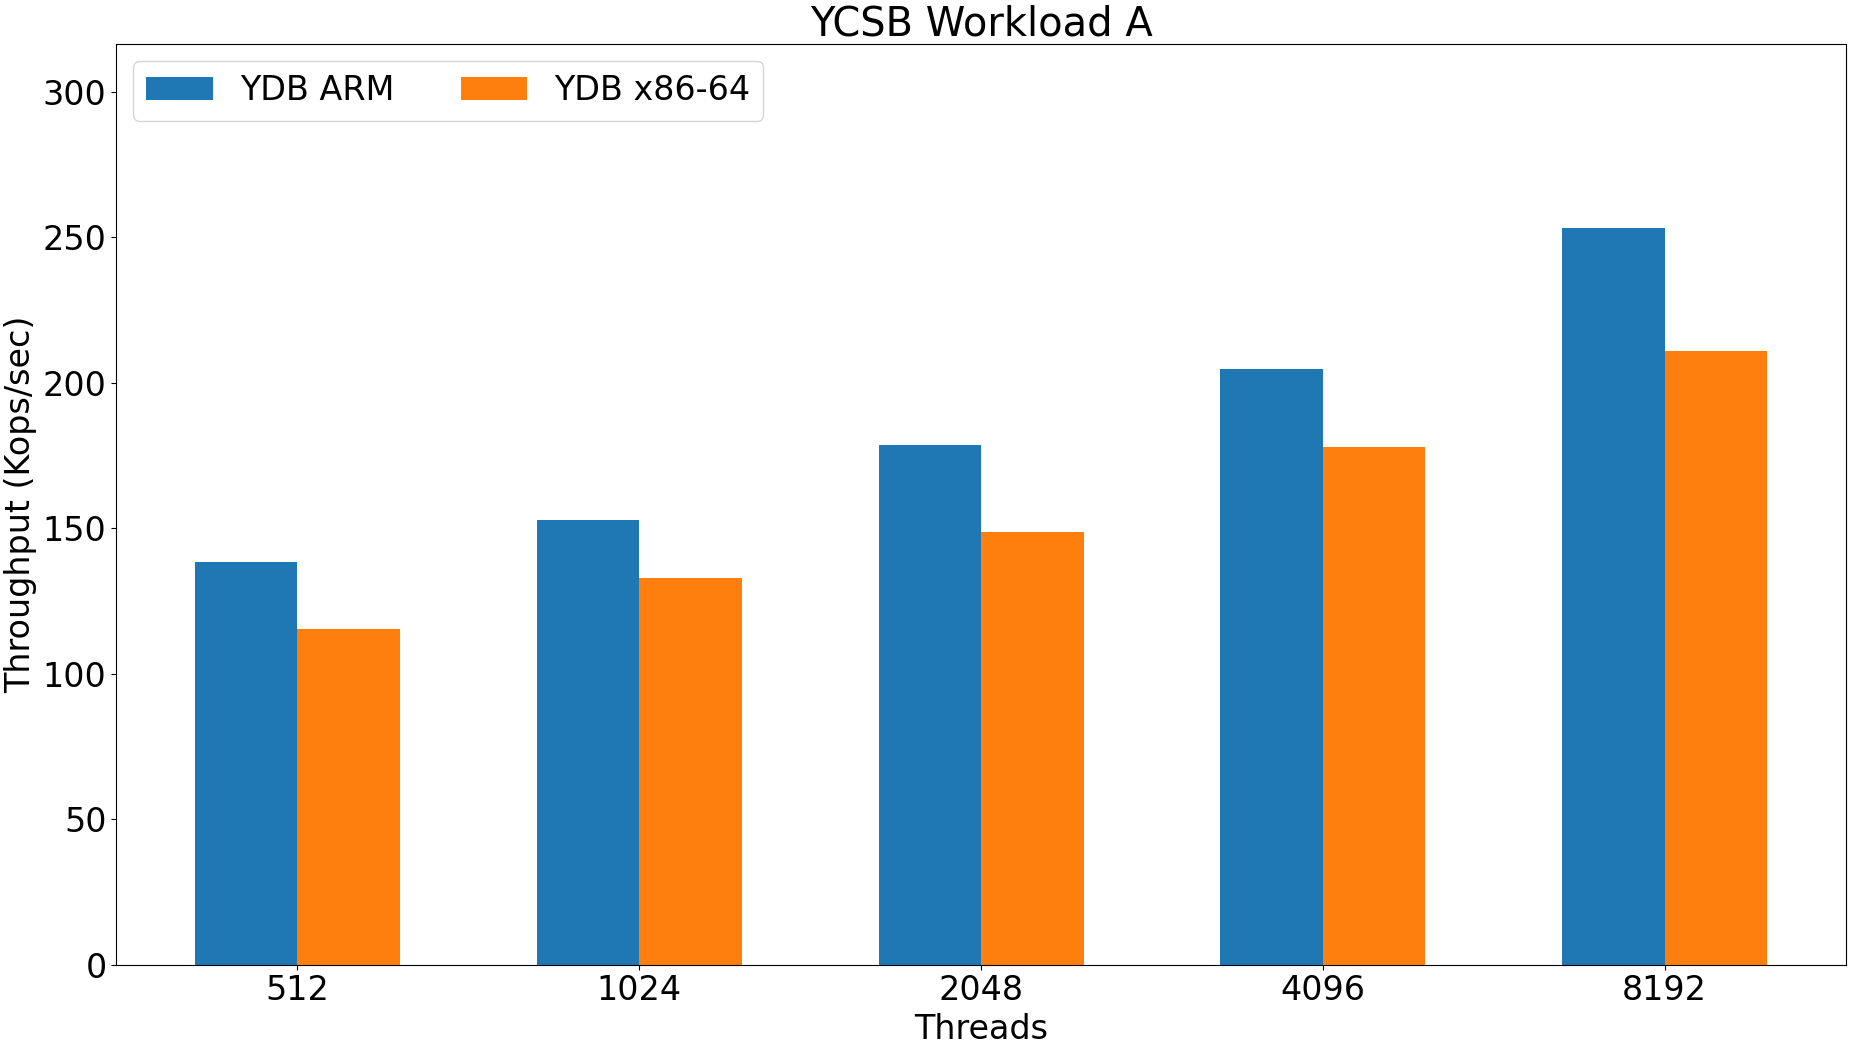
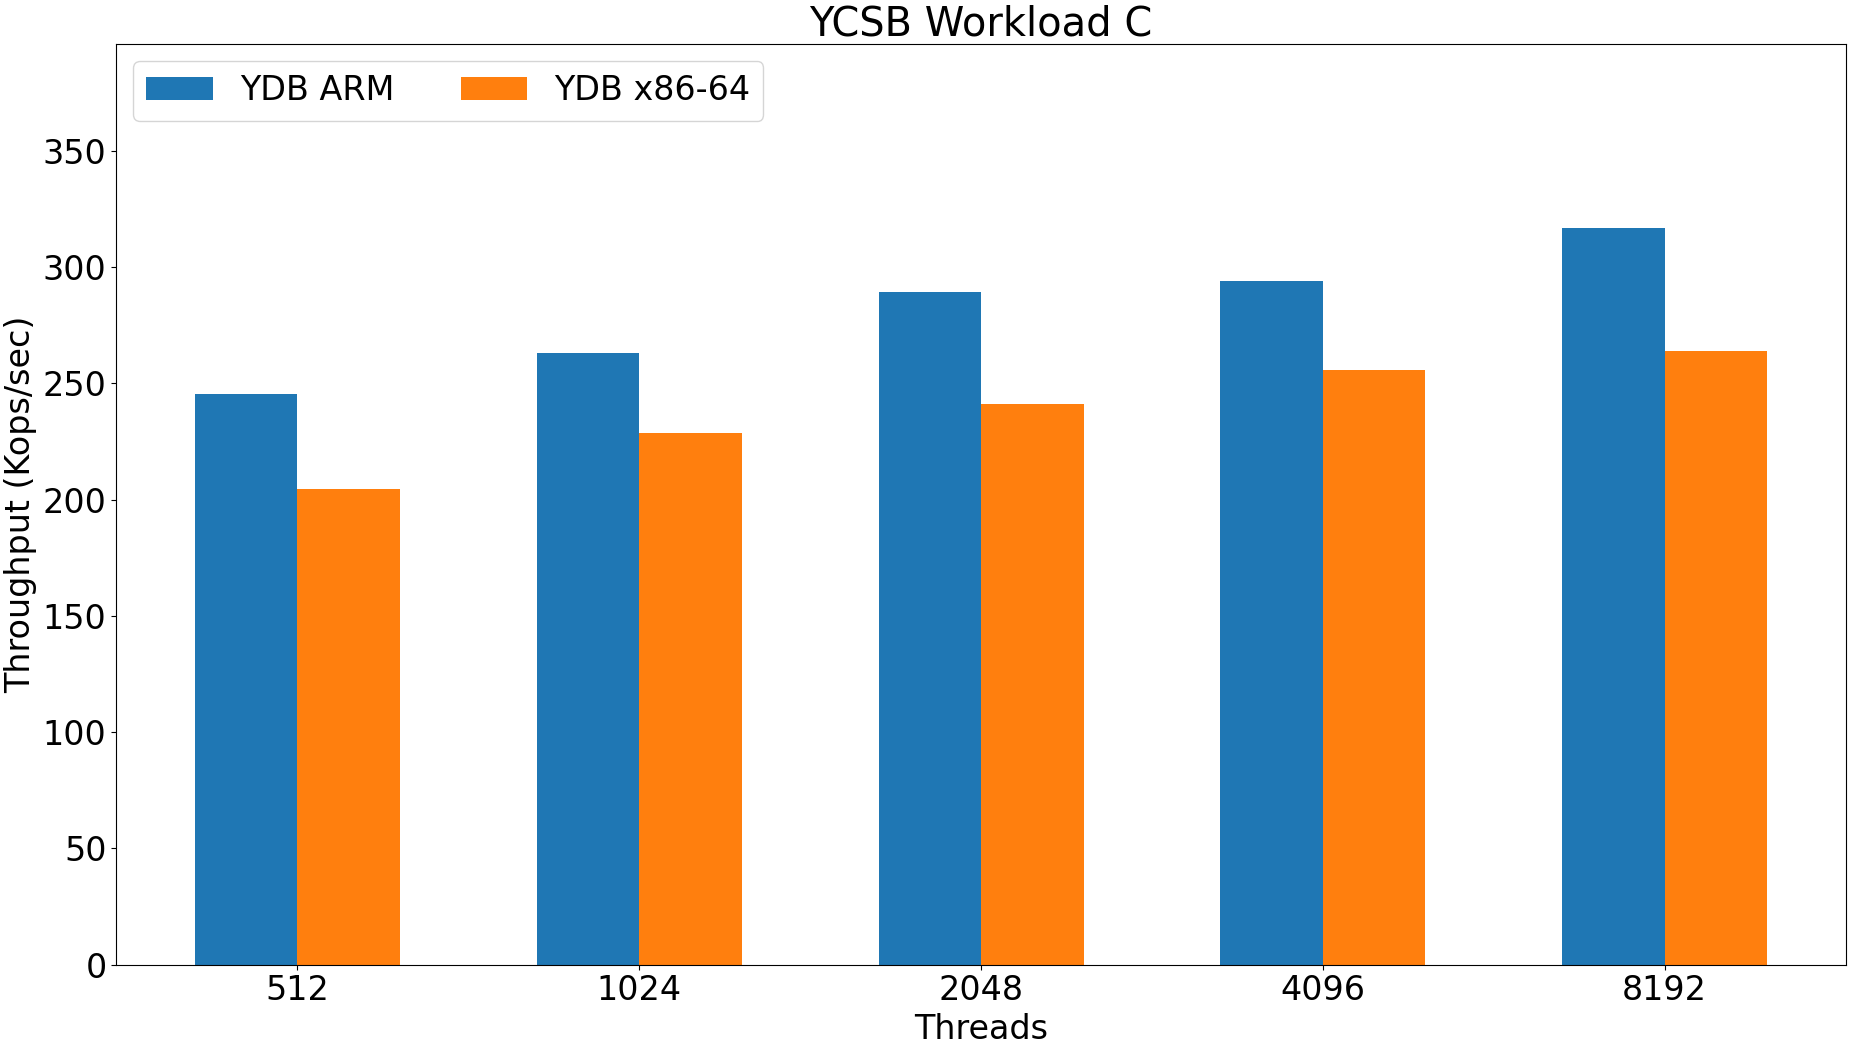
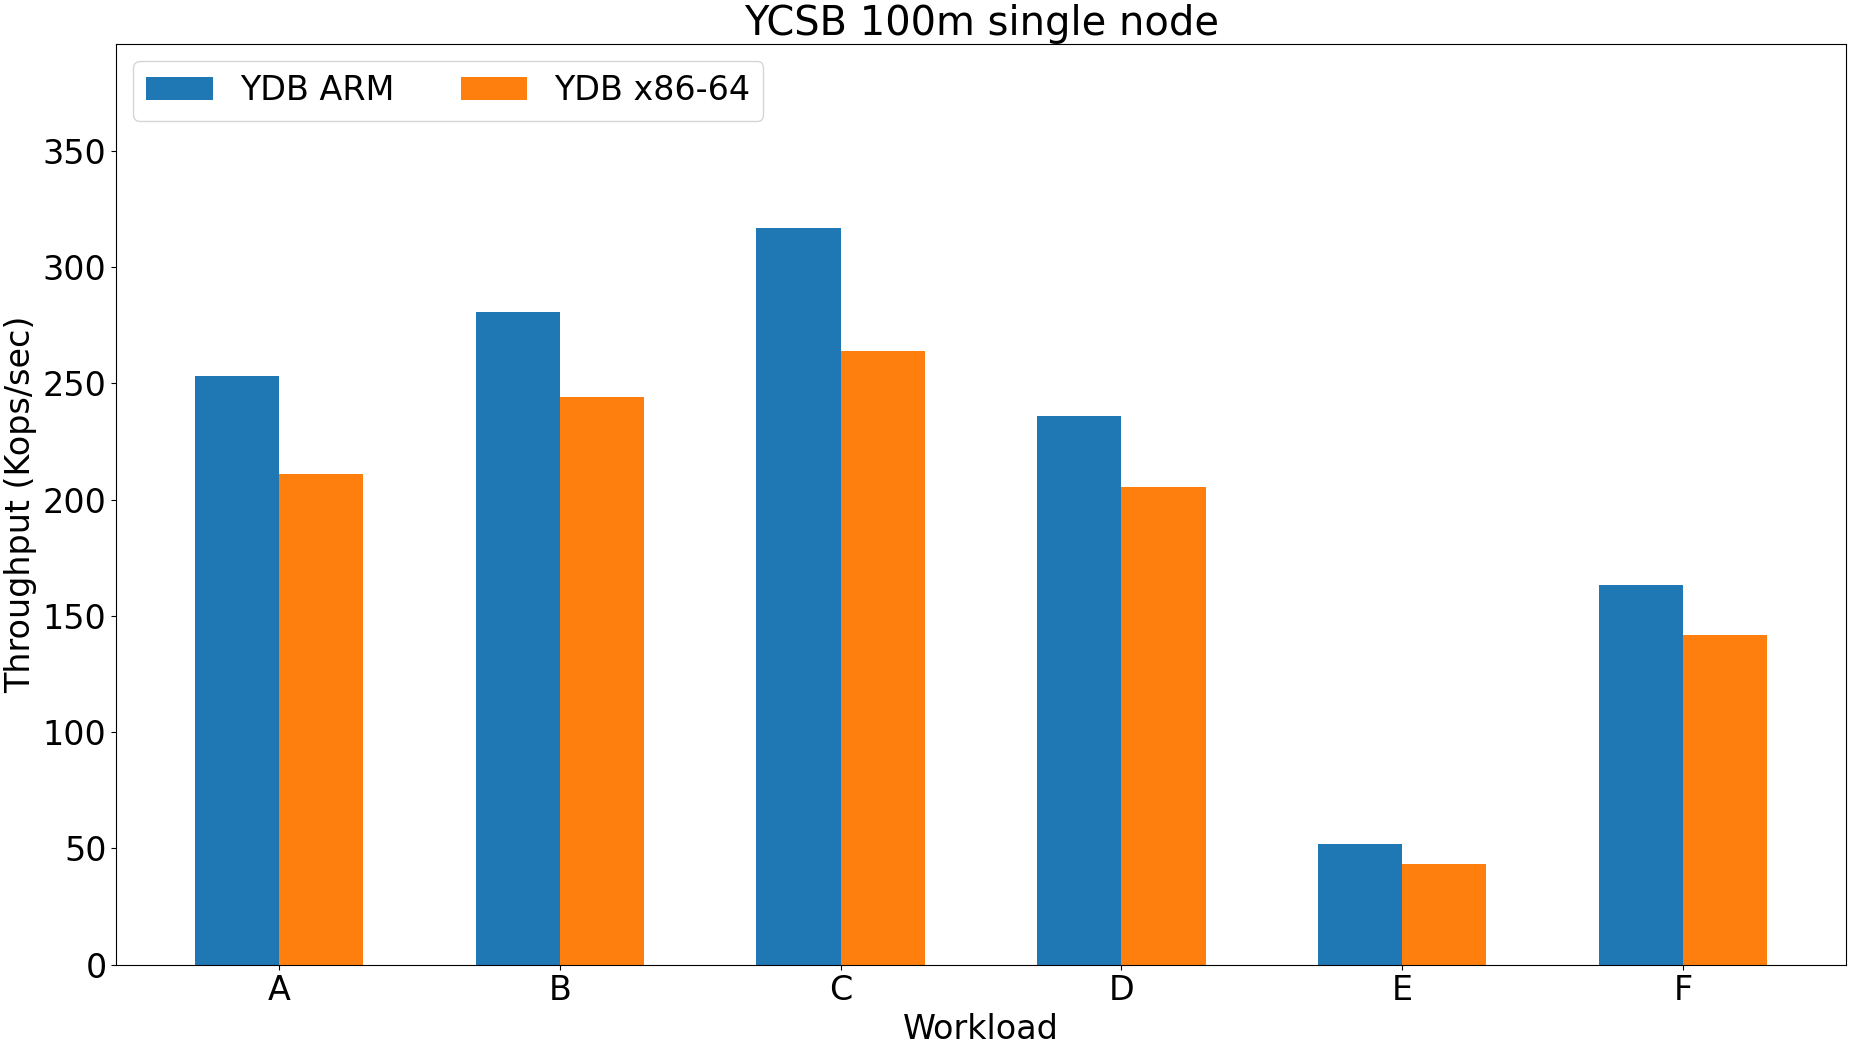
Throughput increases with increase of data size because of partitioning.
ARM is 10-30% faster.
ARM configuration is much more sensitive.
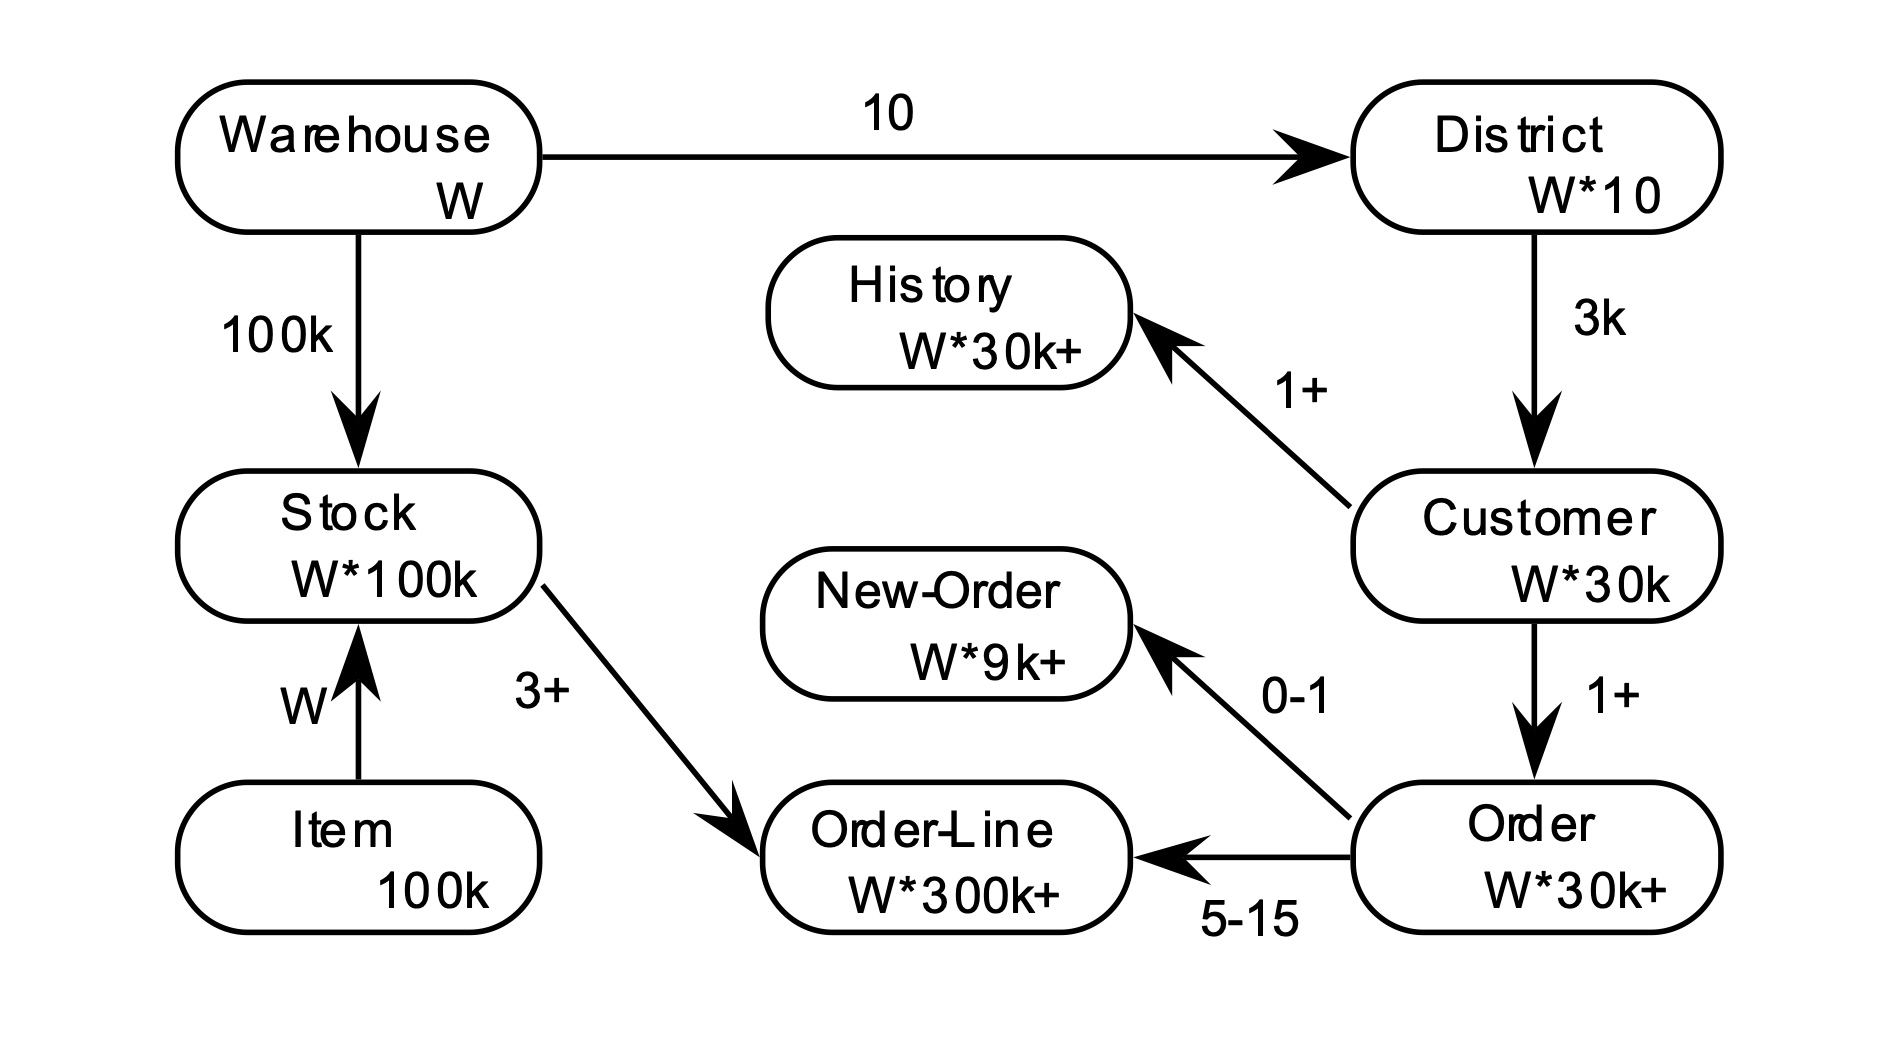
Industry standard benchmark for OLTP databases.
Complex schema for wholesale supplier database.
Can be parameterized only with warehouse count.
Each transaction can access multiple table with complex access patterns.
TPM-C - NewOrder transactions per second.
Efficiency - TPM-C / Maximum possible TPM-C.
Latency numbers for each transaction type.
ARM uploads data 2-3 times faster.
No significant differences in TPM-C on X86-64 and ARM for 10000-15000 warehouses.
Performance improvements:
1. Improve performance of ActorSystem for low-latency KV benchmarks (YCSB, TPC-C).
2. Enable JIT for ARM.
3. ARM tune low-level libraries (ChaCha encryption, XXH3 hash, etc.).
Most problems with ARM optimizations are different cost-model in comparison with X86-64 (virtual functions, atomics).
Some things work great on X86-64, will not work on ARM or will be slow.
Low-level libraries need to be optimized.