Performance Tests
Maksim, developer of ClickHouse.
1. High Level System Architecture.
2. CI/CD Pipeline.
3. Introspection.
4. Abstractions and Algorithms.
5. Libraries.
6. JIT compilation. Dynamic dispatch.
Column-oriented storage — data is physically stored by columns.
Only necessary columns are read from disk during query.
Better compression because of data locality.
Vectorized query execution — data is processed in blocks. Block contains multiple columns with max_block_size rows (65536 by default).
Each column is stored as a vector of primitive data types or their combination:
1. Better utilization for CPU caches and pipeline.
2. Data is processed using SIMD instructions.
Numeric columns — PODArray. Almost the same as std::vector.
1. Use our Allocator with support of realloc.
2. No additional memset during resize.
3. Padding with 15 bytes at the end.
Nullable columns contain data column and UInt8 column bitmask is element null.
Array columns contain data column and UInt64 column with offsets.
Const column contain 1 constant value.
Main class is IColumn.
Polymorphic type that can be part of interfaces.
Declares methods that all concrete column types need to support.
In most of the functions unwrapped to concrete column type.
class IColumn
{
    ...

    [[nodiscard]] virtual Ptr filter(const Filter & filt, ssize_t result_size_hint) const = 0;

    [[nodiscard]] virtual Ptr permute(const Permutation & perm, size_t limit) const = 0;

    virtual void insertFrom(const IColumn & src, size_t n);

    virtual void insertRangeFrom(const IColumn & src, size_t start, size_t length) = 0;

    ...
}
1. Functional, Integration tests.
2. Run all tests with sanitizers (ASAN, TSAN, MSAN).
3. Fuzzers (data types, compression codecs).
4. AST fuzzer.
5. Stress tests (Our special TSAN stress)..
6. Performance tests.
Part of CI/CD pipeline.
Runs for each commit in pull request.
Runs for each commit in the master branch.
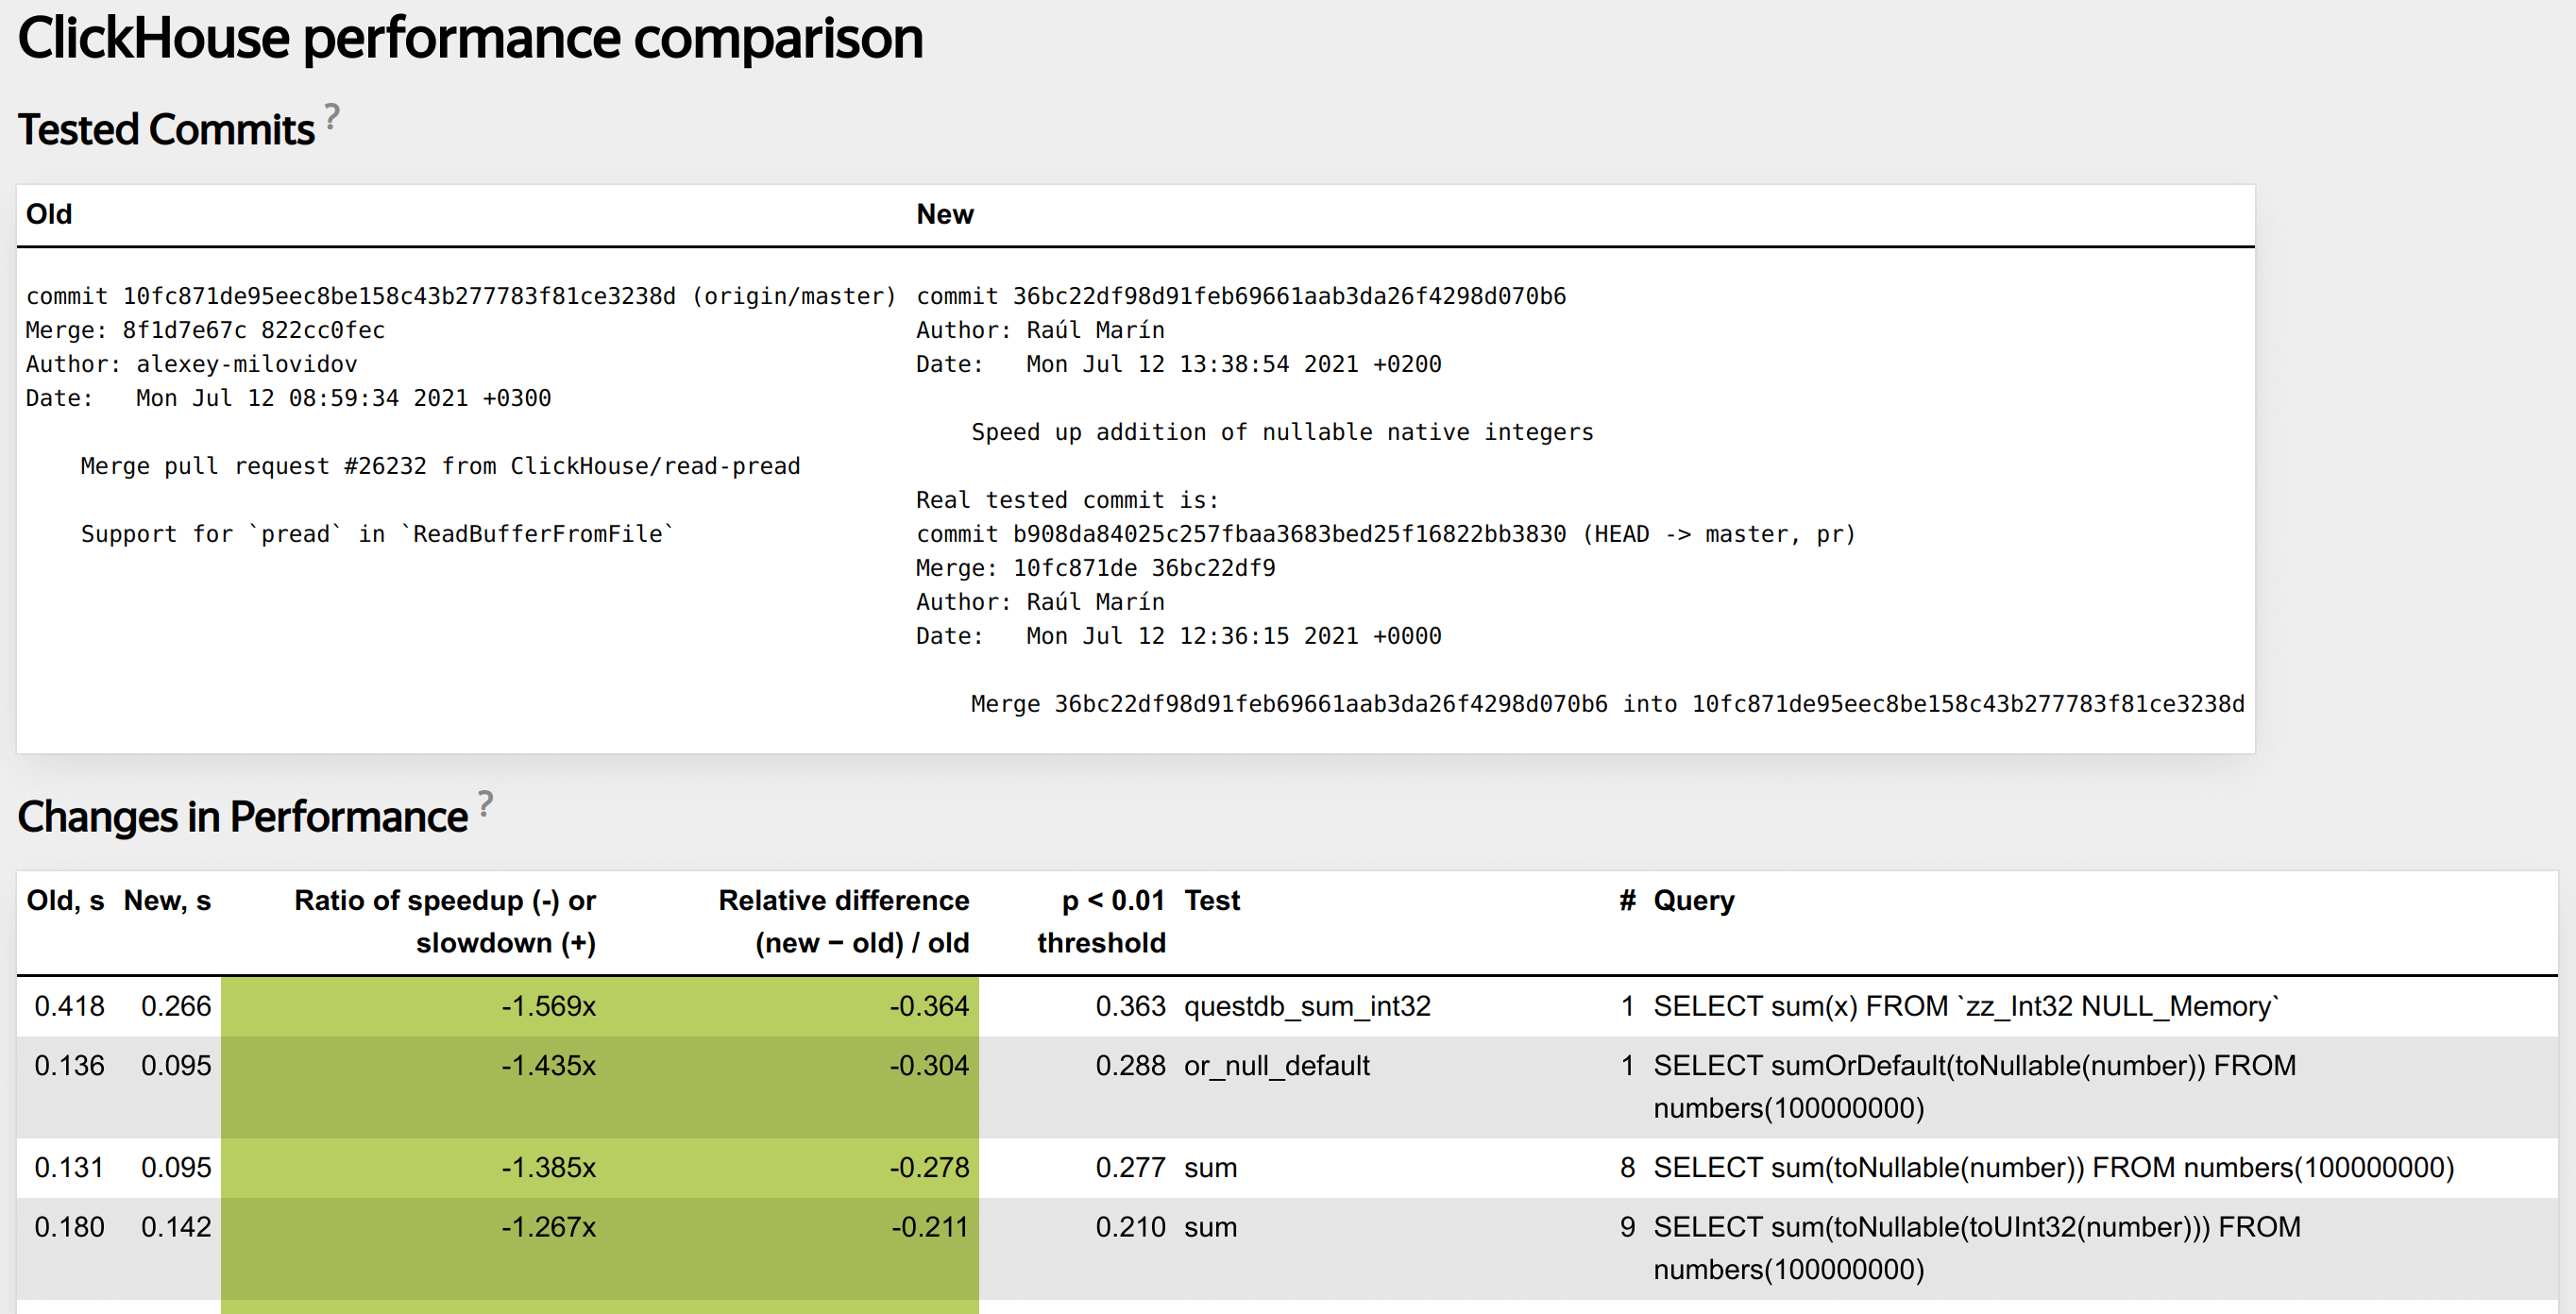
Write test in special XML configuration.
<test>
    <substitutions>
        <substitution>
            <name>func</name>
                <values>
                    bitCount
                    bitNot
                    abs
                    ...
                </values>
        </substitution>

        <substitution>
            <name>expr</name>
                <values>
                    <value>number</value>
                    <value>toUInt32(number)</value>
                    ...
                </values>
        </substitution>
    </substitutions>

    <query>SELECT {func}({expr}) FROM numbers(100000000) FORMAT Null</query>
</test>
Collect different statistics during each performance test run. Can be useful for later debugging.
Processor metrics (CPU cycles, cache misses same as perf-stat).
ClickHouse specific profile events (read bytes from disk, transferred over network, etc).
Helps us find performance regressions.
Nice tool that can help to find places where performance can be improved.
1. Try different allocators, different libraries.
2. Try different compiler options (loop unrolling, inline threshold)
3. Enable AVX/AVX2/AVX512 for build.
Query should not be short, because otherwise it measures nothing.
Query should not be very long. Performance of long queries can be more affected by random external factors.
It is also important to write a query in a special way to check some function, or feature in isolation.
1. Run two server versions simultaneously on the same machine before commit and after commit.
2. Run performance tests against two servers.
3. Measure medians for performance tests runs. Also collect all other possible statistics like CPUBranchMisses, CPUCacheMisses.
4. Use statistical methods to compute the largest difference in median query run T that we can observe even if nothing has changed.
5. Using D difference of medians and T decide if changes in performance are significant.
https://clickhouse.com/blog/testing-the-performance-of-click-house/If T is greater than 10 percent, the query is unstable.
For such a query we cannot detect any changes in performance because even if nothing has changed query time can be affected.
Should we just delete tests with unstable queries?
Several examples why query can be unstable:
1. Excessive allocations.
2. Large copying.
3. Bad written query.
4. External factors (disks, network, background activities, bugs in kernel).
We should only delete/rewrite tests with bad written queries. Other cases require deep investigation.
<test>
    <query>
        SELECT detectLanguageUnknown(SearchPhrase)
        FROM hits_100m_single
        LIMIT 500000
        FORMAT Null
    </query>
    <query>
        SELECT detectCharset(SearchPhrase)
        FROM hits_100m_single
        LIMIT 500000
        FORMAT Null
    </query>
</test>
Functions detectCharset, detectLanguageUnknown inner loop:
for (size_t i = 0; i < offsets.size(); ++i)
{
    const UInt8 * str = data.data() + offsets[i - 1];
    const size_t str_len = offsets[i] - offsets[i - 1] - 1;

    HashMap<UInt16, UInt64, DefaultHash<UInt16>, 4> model;

    /// Calculate string ngrams
    calculateStats(str, str_len, model);

    /// Compare ngrams with known encodings dictionaries and get result value
    std::string_view result_value = matchEncoding(model, encodings_frequency);

    /// Write result value into column
    writeResult(result_column, result_value);
}
Functions detectCharset, detectLanguageUnknown inner loop:
for (size_t i = 0; i < offsets.size(); ++i)
{
    const UInt8 * str = data.data() + offsets[i - 1];
    const size_t str_len = offsets[i] - offsets[i - 1] - 1;

    HashMapWithStackMemory<UInt16, UInt64, DefaultHash<UInt16>, 4> model;

    /// Calculate string ngrams
    calculateStats(str, str_len, model);

    /// Compare ngrams with known encodings dictionaries and get result value
    std::string_view result_value = matchEncoding(model, encodings_frequency);

    /// Write result value into column
    writeResult(result_column, result_value);
}
<test>
    <query>
        SELECT toString(rand()) IN ('41577', '83972', /*big_array*/);
    </query>
    <query>
        SELECT (rand(), rand()) IN ((17258, 93148), /*big array of tuples*/);
    </query>
</test>
Constant evaluation during query processing analyze part.
std::pair<Field, std::shared_ptr<const IDataType>>
evaluateConstantExpression(const ASTPtr & node, ContextPtr context)
{
    /// Derive AST expression data type and evaluate it into constant Field
}
Constant evaluation during query processing analyze part.
class ASTLiteral : public ASTWithAlias
{
public:
    explicit ASTLiteral(Field value_) : value(std::move(value_)) {}

    Field value;

    ...
}

std::pair<Field, std::shared_ptr<const IDataType>>
evaluateConstantExpression(const ASTPtr & node, ContextPtr context)
{
    /// Derive AST expression data type and evaluate it into constant Field

    if (ASTLiteral * literal = node->as<ASTLiteral>())
        return {literal->value, applyVisitor(FieldToDataType(), literal->value)};
}
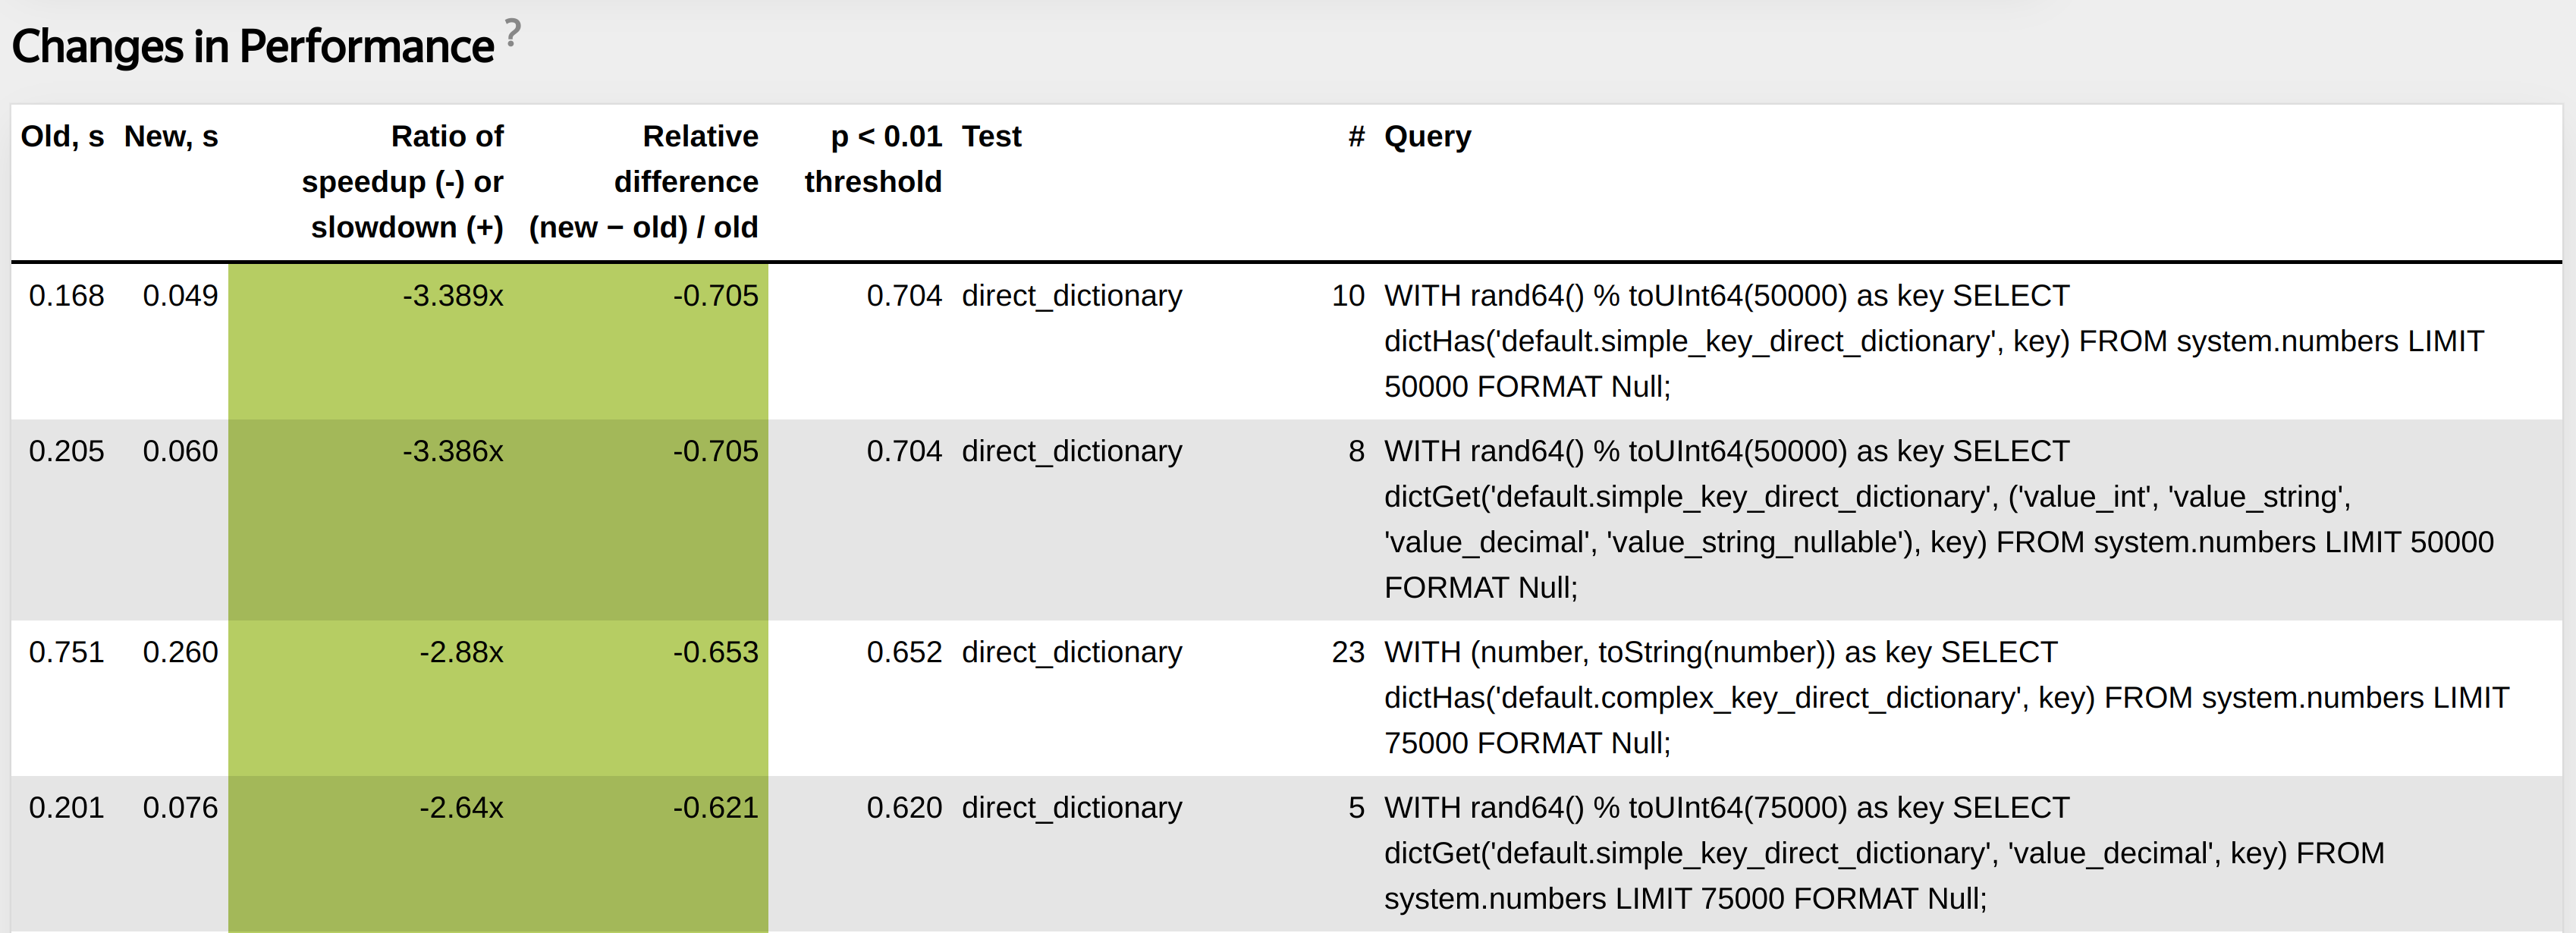
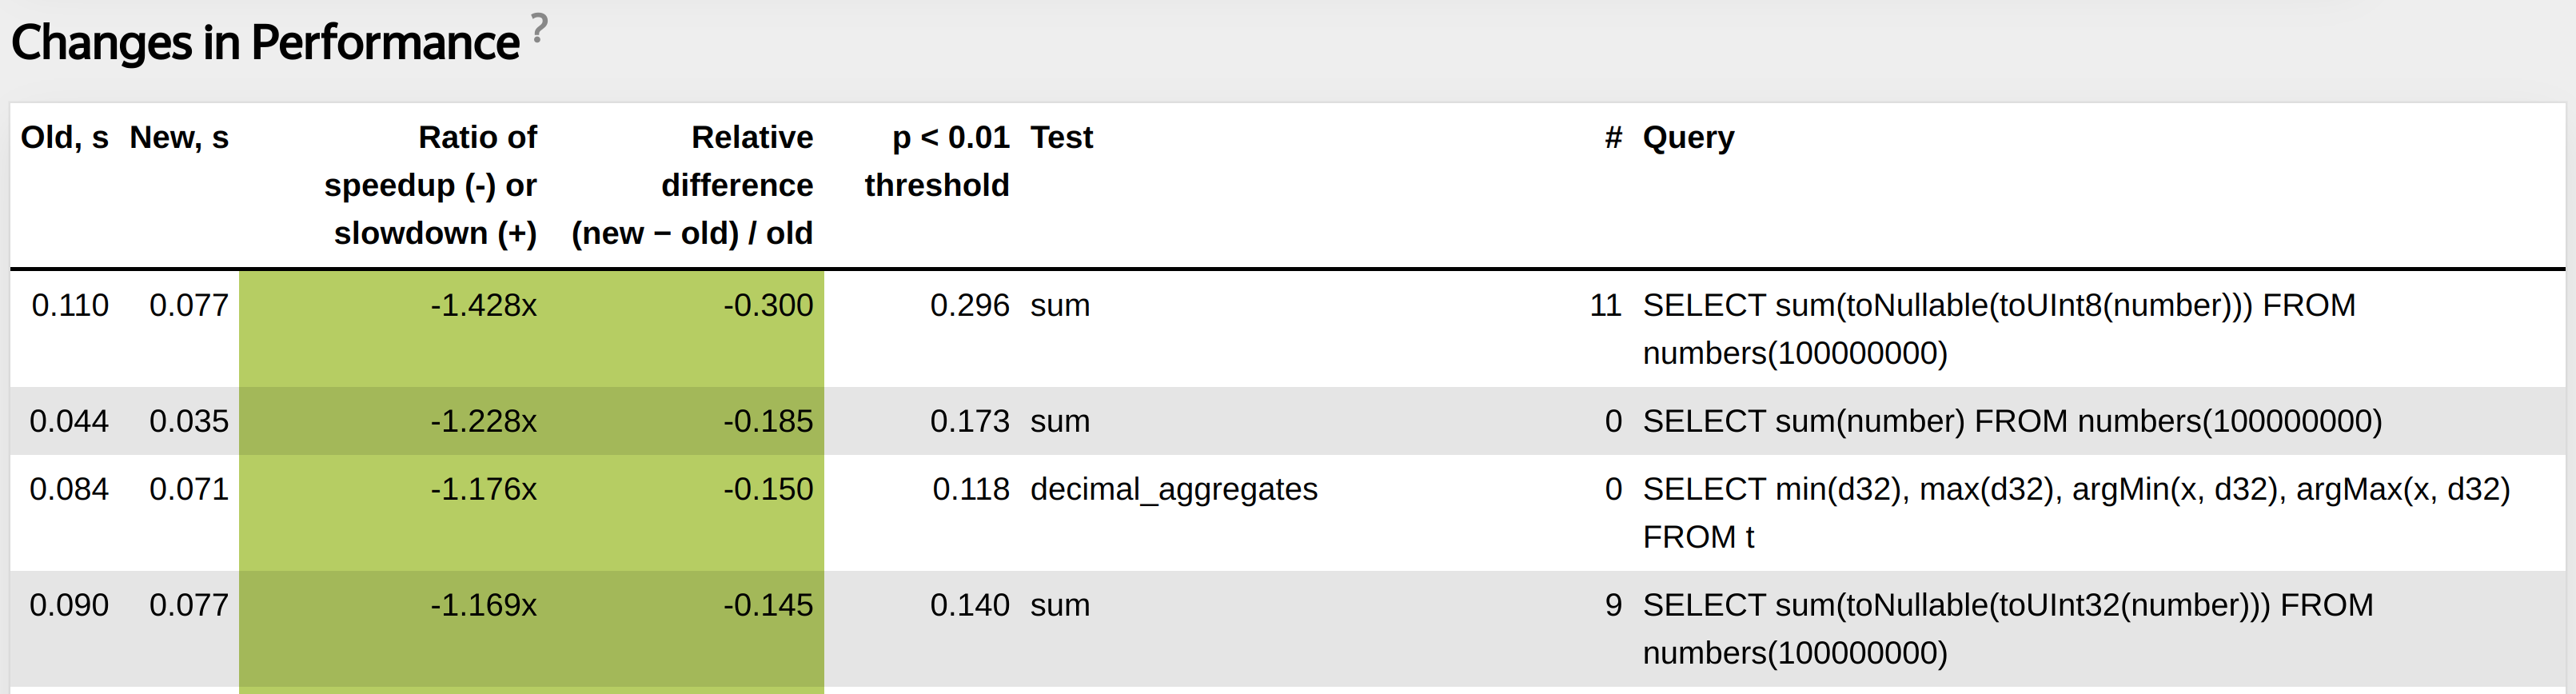
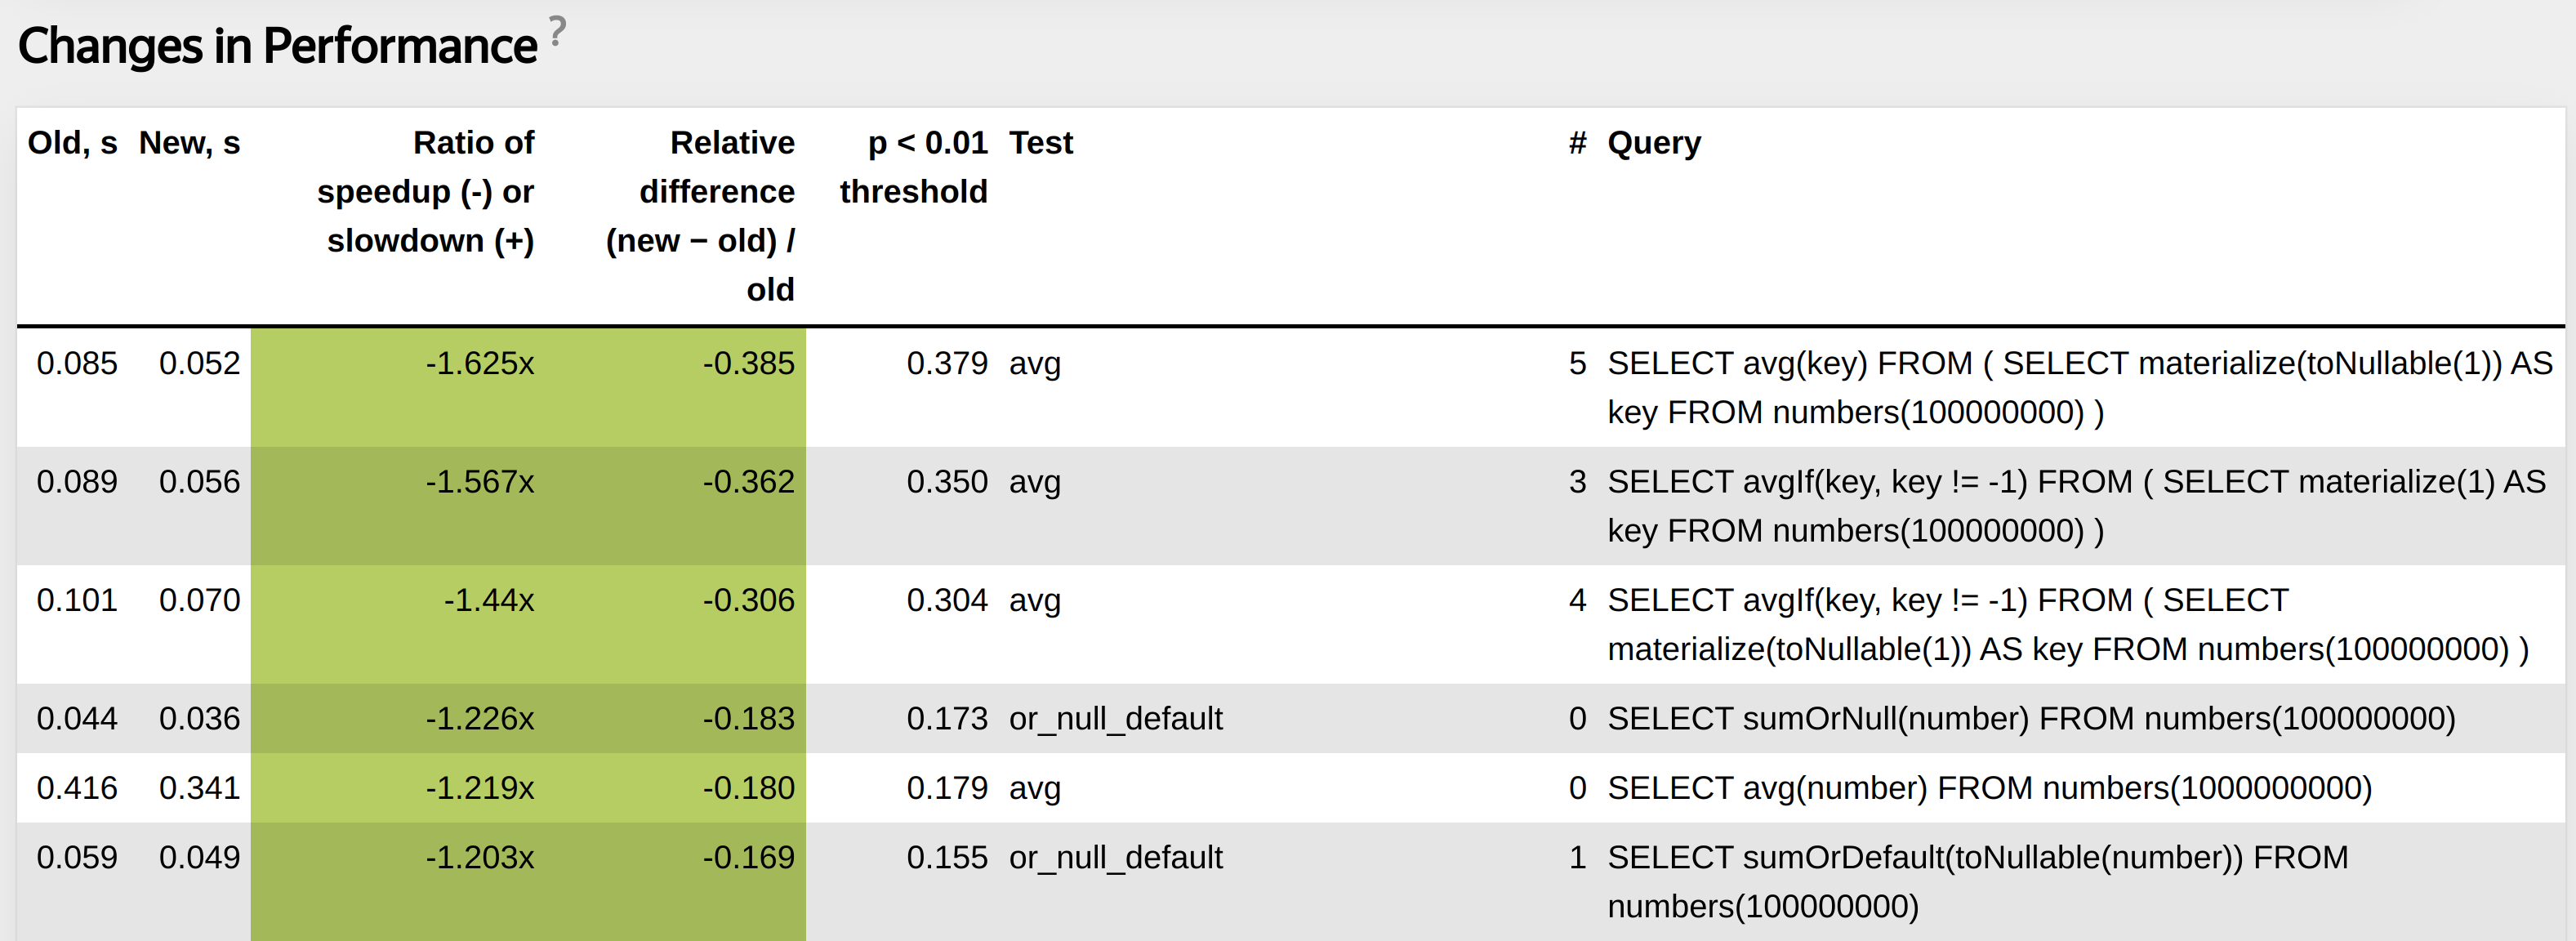
Performance improvements after change:
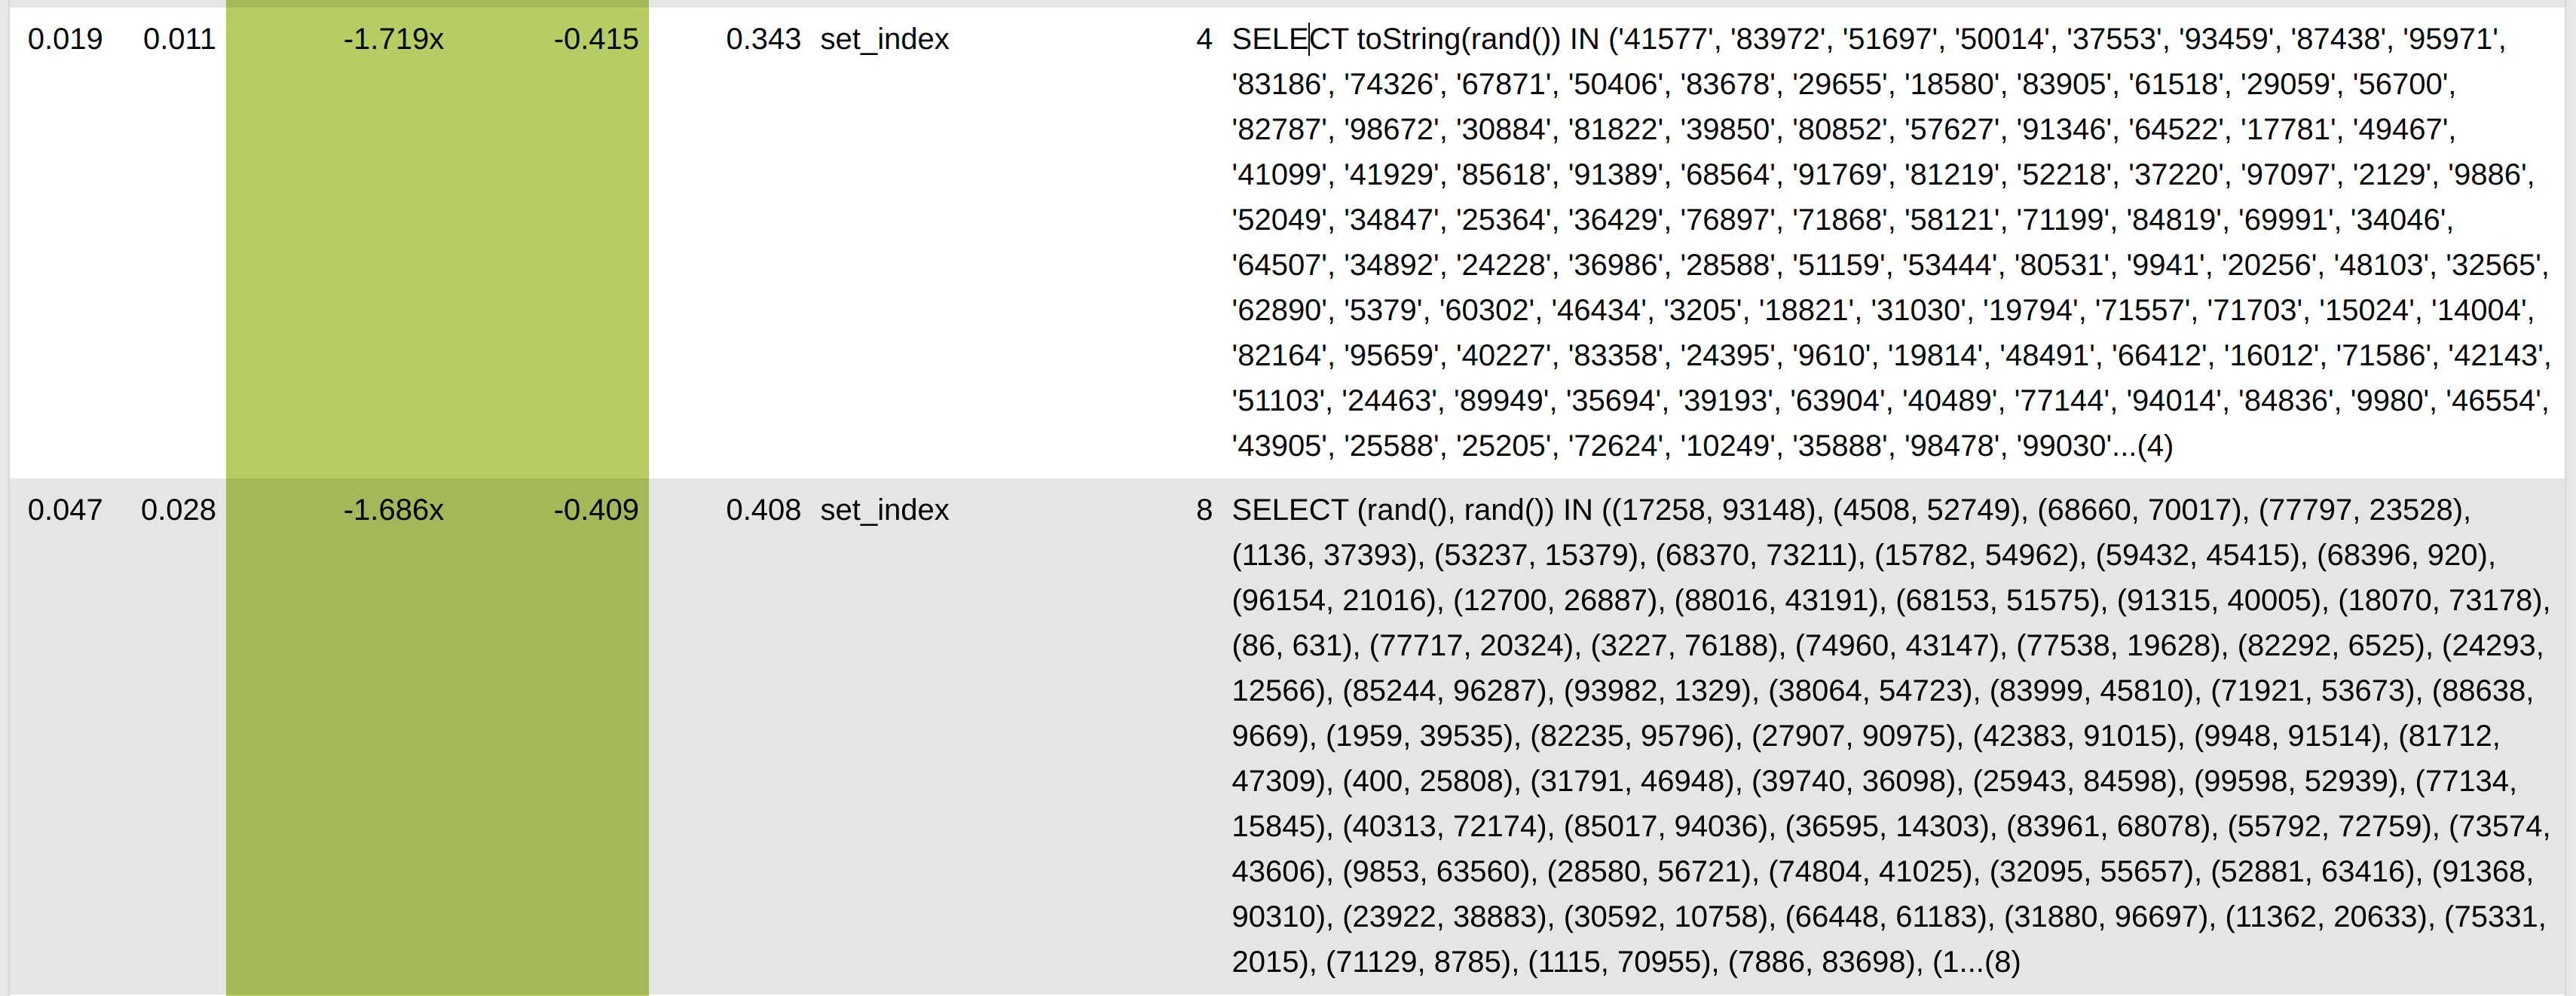
For other performance tests, which construct big IN sections as part of their internal implementation we also saw improvement.
Collect ProfileEvents for each query:
RealTimeMicroseconds, UserTimeMicroseconds, SystemTimeMicroseconds, SoftPageFaults, HardPageFaults using getrusage system call.
https://man7.org/linux/man-pages/man2/getrusage.2.htmlCollect ProfileEvents for each query:
Collect :taskstats from procFS.
OSCPUVirtualTimeMicroseconds, OSCPUWaitMicroseconds (when /proc/thread-self/schedstat is available)
OSIOWaitMicroseconds (when /proc/thread-self/stat is available)
OSReadChars, OSWriteChars, OSReadBytes, OSWriteBytes (when /proc/thread-self/io is available)
We also support Netlink interface.
Collect ProfileEvents for each query:
Hardware specific counters CPU cache misses, CPU branch mispredictions using perf_event_open system call.
https://man7.org/linux/man-pages/man2/perf_event_open.2.htmlCollect ProfileEvents for each query:
Different ClickHouse specific metrics FileOpen, DiskReadElapsedMicroseconds, NetworkSendBytes.
SELECT PE.Names AS ProfileEventName, PE.Values AS ProfileEventValue
FROM system.query_log ARRAY JOIN ProfileEvents AS PE
WHERE query_id='344b07d9-9d7a-48f0-a17e-6f5f6f3d61f5'
AND ProfileEventName LIKE 'Perf%';
┌─ProfileEventName─────────────┬─ProfileEventValue─┐
│ PerfCpuCycles                │       40496995274 │
│ PerfInstructions             │       57259199973 │
│ PerfCacheReferences          │        2072274618 │
│ PerfCacheMisses              │         146570206 │
│ PerfBranchInstructions       │        8675194991 │
│ PerfBranchMisses             │         259531879 │
│ PerfStalledCyclesFrontend    │         813419527 │
│ PerfStalledCyclesBackend     │       15797162832 │
│ PerfCpuClock                 │       10587371854 │
│ PerfTaskClock                │       10587382785 │
│ PerfContextSwitches          │              3009 │
│ PerfCpuMigrations            │               113 │
│ PerfMinEnabledTime           │       10584952104 │
│ PerfMinEnabledRunningTime    │        4348089512 │
│ PerfDataTLBReferences        │         465992961 │
│ PerfDataTLBMisses            │           5149603 │
│ PerfInstructionTLBReferences │           1344998 │
│ PerfInstructionTLBMisses     │            181635 │
└──────────────────────────────┴───────────────────┘
Periodically collect stack traces from all currently running threads.
Binary must be compiled with -fasynchronous-unwind-tables.
Send signal and collect traces in the signal handler, then put them in a special system table allowing for introspection.
1. There can be many edge cases during stack unwinding when .eh_frame section can contain broken unwind instructions (bug in compiler, bug in hand written assembly). LLVM libunwind will crash.
2. Unwind library should be signal safe, no allocations during traces collection.
Currently using a patched fork of LLVM libunwind.
Check all threads current stack trace from system.stack_trace
WITH arrayMap(x -> demangle(addressToSymbol(x)), trace) AS all
SELECT thread_name, thread_id, query_id, arrayStringConcat(all, '\n') AS res
FROM system.stack_trace LIMIT 1 FORMAT Vertical;
Row 1:
──────
thread_name: clickhouse-serv
thread_id:   125441
query_id:
res:         pthread_cond_wait
std::__1::condition_variable::wait(std::__1::unique_lock&)
BaseDaemon::waitForTerminationRequest()
DB::Server::main(/*arguments*/)
Poco::Util::Application::run()
DB::Server::run()
Poco::Util::ServerApplication::run(int, char**)
mainEntryClickHouseServer(int, char**)
main
__libc_start_main
_start
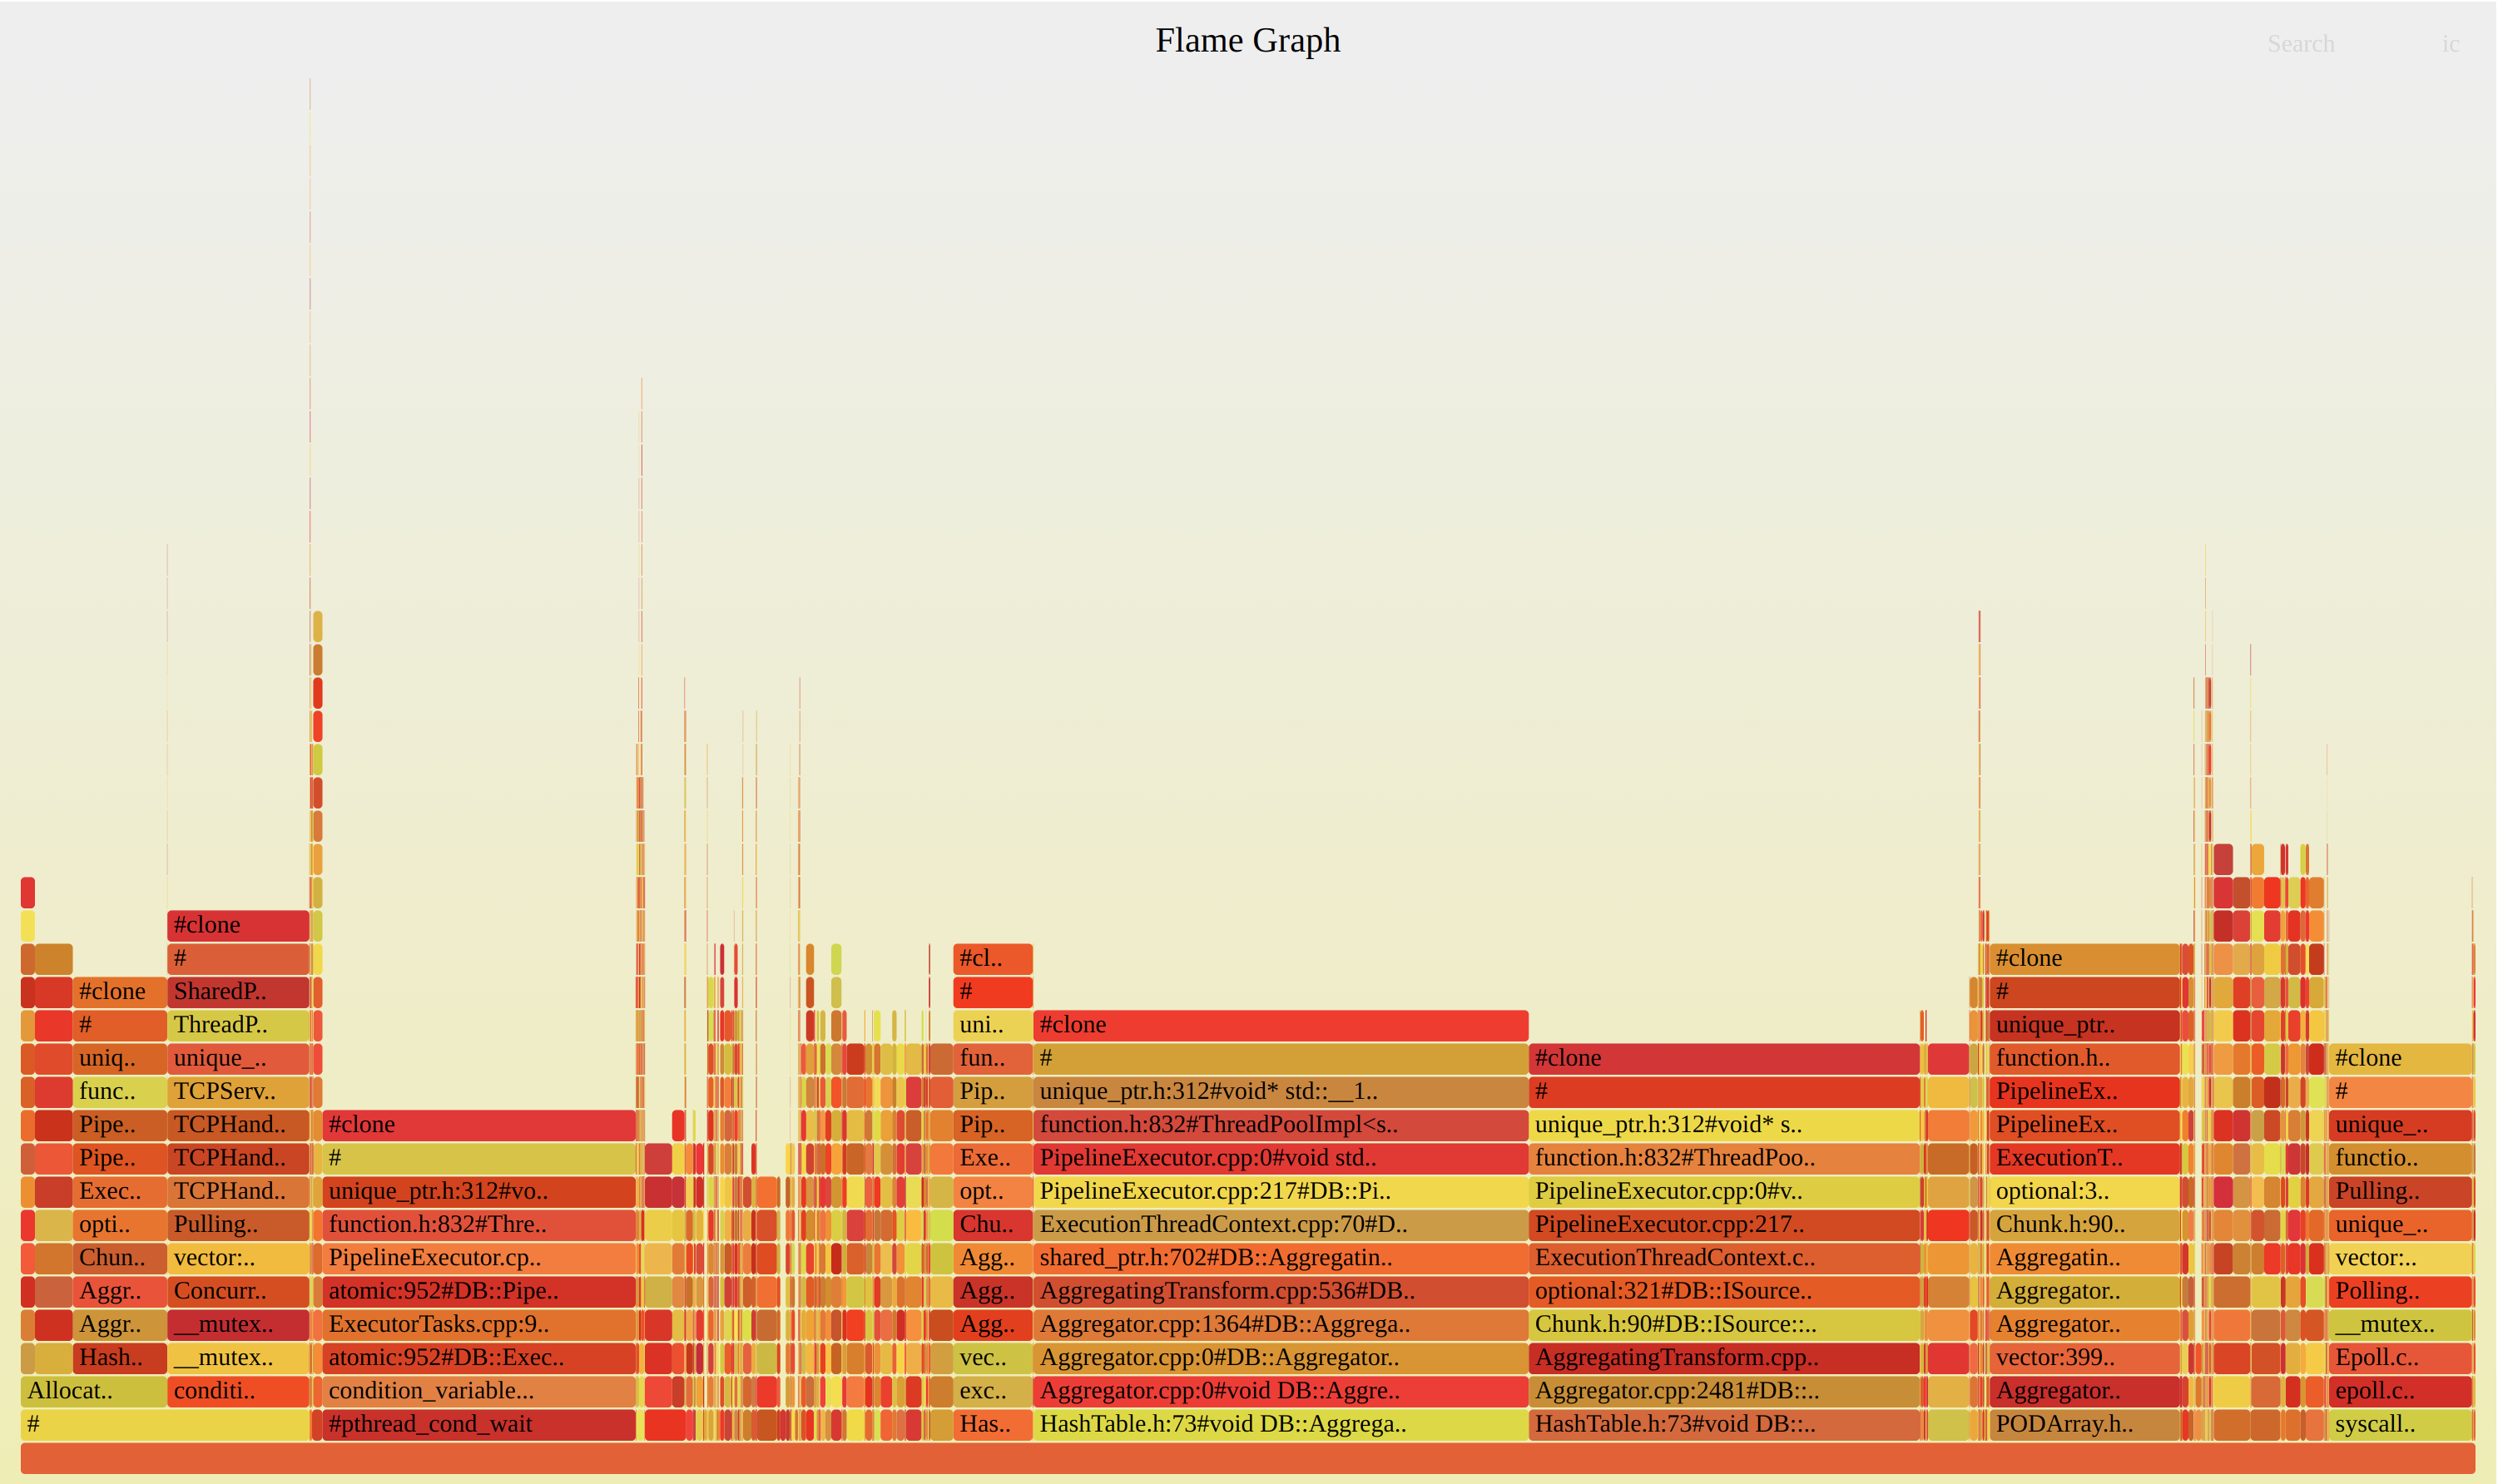
Generate flamegraph of query execution
./clickhouse-client --query="SELECT
arrayStringConcat(
    arrayMap(x -> concat(
        splitByChar('/', addressToLine(x))[-1],
        '#',
        demangle(addressToSymbol(x))),
        trace),
    ';') AS stack,
count(*) AS samples
FROM system.trace_log
WHERE (trace_type = 'Real') AND (query_id = '344b07d9-9d7a-48f0-a17e-6f5f6f3d61f5')
GROUP BY trace" | flamegraph.pl
For high performance systems interfaces must be determined by algorithms
Top-down approach does not work.
High-performance system must be designed concentrating on doing a single task efficiently.
Designed from hardware capabilities.
ClickHouse was designed to efficiently FILTER and GROUP BY data that fits in RAM.
There is no silver bullet, or best algorithm for any task.
Try to choose the fastest possible algorithm/algorithms for your specific task.
Performance must be evaluated on real data.
Most of the algorithms are affected by data distribution.
Complex task can be viewed as number of small tasks.
Such small tasks can also be viewed as special cases that can be optimized.
For any task there are dozens of different algorithms that can be combined together (Example Sorting, Aggregation).
Each algorithm can be tuned later using different low-level optimizations (Data layout, Specializations, SIMD instructions, JIT compilation).
High level design desigion — data must be processed not only by multiple threads, but by multiple servers.
Core component is the HashTable framework.
Different HashTable for different types of keys (Special StringHashTable for Strings).
Additional specializations for Nullable, LowCardinality
Tuned a lot of low-level details, like allocations, structures layout in memory, batch multiple operations to avoid virtual function calls.
Added JIT compilation for special cases.
Added cache of hash-table sizes.
Optimizing performance is about trying different approaches.
Most of the time without any results.
Each problem can have a lot degrees of freedom. For example Sorting:
Stable / nonstable?
External / in RAM?
With limit/without limit?
Is the data already almost sorted?
What about data distribution? How many unique values?
Can we use vectorized sorting algorithms?
Can we allocate additional memory?
Insert into ClickHouse main storage engine MergeTree
Must be very fast.
Data ingestion in ClickHouse is one of the main selling points.
We just sort a block of data that was inserted in ClickHouse by PRIMARY KEY and then write to disk. That is it.
void stableGetPermutation(const Block & block, const SortDescription & description,
    IColumn::Permutation & out_permutation)
{
    size_t size = block.rows();
    out_permutation.resize(size);
    for (size_t i = 0; i < size; ++i)
        out_permutation[i] = i;

    auto sort_desc = getColumnsWithSortDescription(block, description);
    auto cmp = PartialSortingLess(sort_desc);
    std::stable_sort(out_permutation.begin(), out_permutation.end(), cmp);
}
ALWAYS_INLINE int compare(size_t lhs, size_t rhs) const
{
    int res = 0;

    for (const auto & elem : columns)
    {
        auto nulls_direction = elem.description.nulls_direction;
        res = elem.column->compareAt(lhs, rhs, *elem.column, nulls_direction);
        res *= elem.description.direction;

        if (res != 0)
            break;
    }

    return res;
}
Worst thing for column databases is to process elements in rows.
class ColumnVector : IColumn
{
...
    int compareAt(size_t n, size_t m,
        const IColumn & rhs_, int nan_direction_hint) const override
    {
        auto rhs_value = assert_cast<const Self &>(rhs_).data[m];
        return CompareHelper<T>::compare(data[n], rhs_value, nan_direction_hint);
    }
...
};
Solution:
For a single column it is easy, we can just call getPermutation method directly. We need to change interface to support stable sort.
For multiple columns need to change interface of updatePermutation method to also support stable sort.
Update permutation method sort data only for equal ranges (initially 1 pair with values 0 and block size), and update equal ranges array. For the next column updatePermutation call will finish sorting only for these equal ranges.
Update IColumn base interface. Also update all subclasses.
Additional special cases for Nullable, LowCardinality, Sparse columns.
class IColumn {
...

virtual void getPermutation(PermutationSortDirection direction,
    PermutationSortStability stability, size_t limit, int nan_direction_hint,
    Permutation & res) const = 0;

virtual void updatePermutation(PermutationSortDirection direction,
    PermutationSortStability stability, size_t limit, int nan_direction_hint,
    Permutation & res, EqualRanges & equal_ranges) const = 0;
}
Performance results for random data.
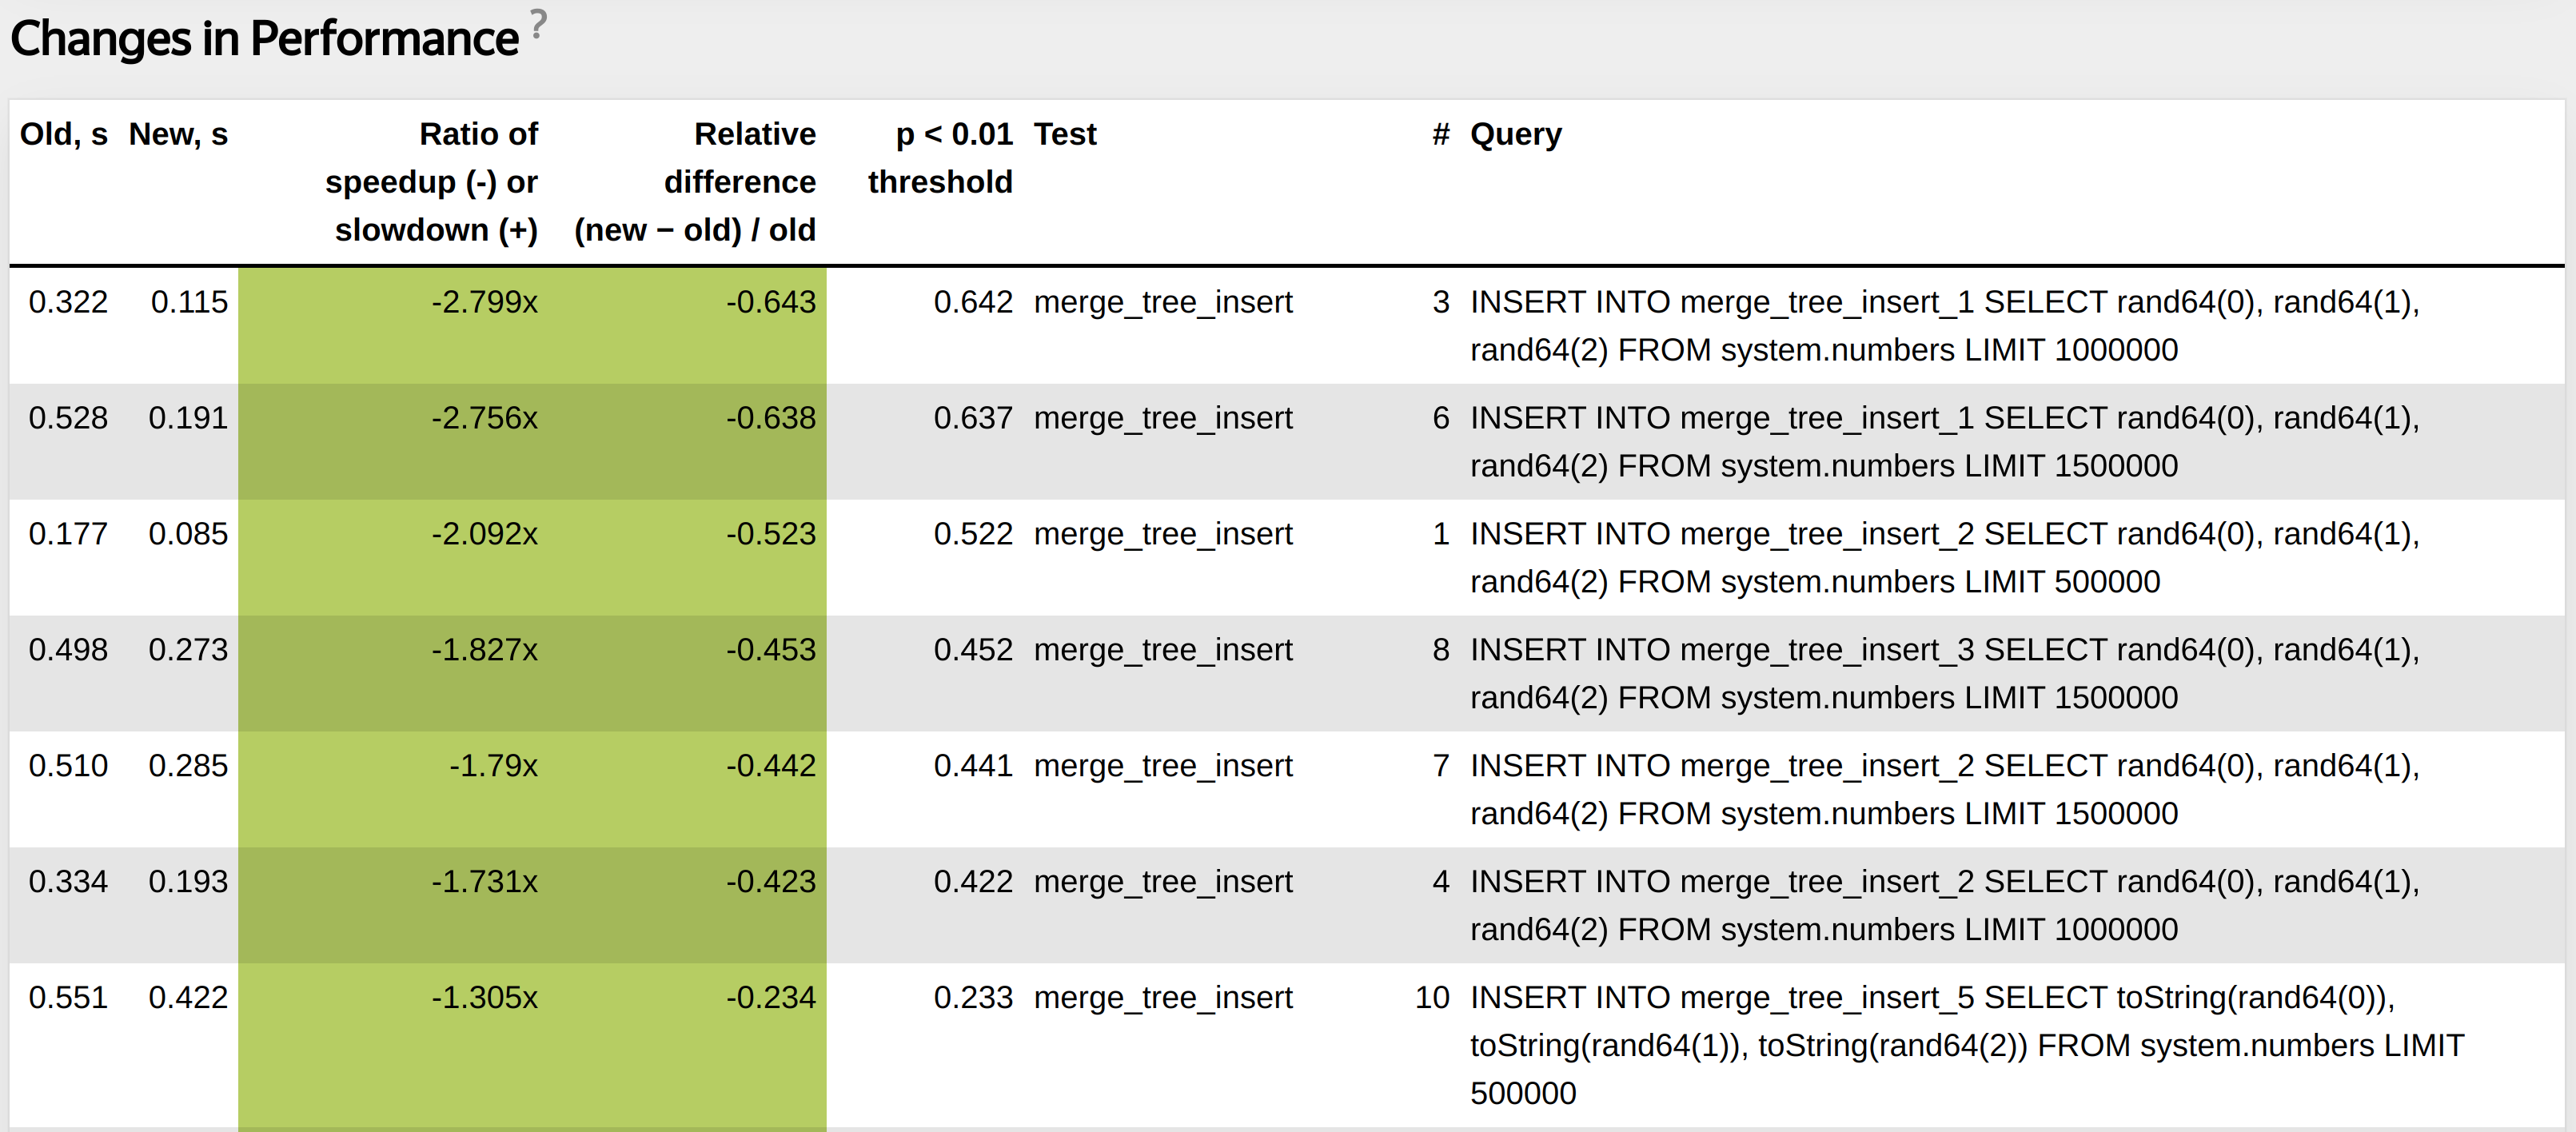
Performance results for production data.
INSERT INTO test_hits_insert
            SELECT UserID, WatchID, CounterID
            FROM hits_100m_single
Was: 22.043 sec (4.54 million rows/s., 90.73 MB/s.)
Now: 11.268 sec (8.87 million rows/s., 177.50 MB/s.)
If someone on the Internet says my algorithm is fastest we will try it in ClickHouse.
Always try to find interesting algorithms, and solutions.
ClickHouse/contrib$ ls | grep -v "cmake" | wc -l
95
1. Different algorithms for parsing floats, json (multiple libraries).
2. A lot of integrations.
3. Embedded storages.
4. LLVM for JIT compilation.
5. libcxx (C++ standard library).
Almost in any library our CI system finds bugs. We report them to maintainers.
We also have a lot of library forks with a lot of changes. For example POCO, LLVM libunwind.
We are not afraid of adding additional contrib. Our CI system will do the job.
We have high-performance IO Framework, HashTable Framework, Different Data Structures, Vectorized Engine.
Should we make ClickHouse a library?
Vote for it.
JIT compilation can transform dynamic configuration into static configuration.
Not all functions can be easily compiled, not all algorithms can be easily compiled.
Has its own costs (compilation time, memory, maintenance).
But can greatly improve performance in special cases.
Compile evaluation of multiple expressions. Example: SELECT a + b * c + 5 FROM test_table;
Compile special cases for GROUP BY. Example: SELECT sum(a), avg(b), count(c) FROM test_table;
Compile comparator in ORDER BY. Example: SELECT * FROM test_table ORDER BY a, b, c;
In all cases we transform dynamic configuration into static.
My presentation from CPP Russia 2021 JIT in ClickHouse:
Compile evaluation of multiple expressions. Example: SELECT a + b * c + 5 FROM test_table;
void aPlusBMulitplyCPlusConstant(
    int64_t * a,
    int64_t * b,
    int64_t * c,
    int64_t constant,
    int64_t * result,
    size_t size)
{
    for (size_t i = 0; i < size; ++i)
    {
        *result = (*a) + (*b) * (*c) + constant;

        ++a;
        ++b;
        ++c;
        ++result;
    }
}
.LBB0_8:                                # %vector.body
    vmovdqu	(%r11,%rax,8), %ymm1
    vmovdqu	(%r9,%rax,8), %ymm3
    vmovdqu	32(%r11,%rax,8), %ymm2
    vmovdqu	32(%r9,%rax,8), %ymm4
    vpsrlq	$32, %ymm3, %ymm5
    vpsrlq	$32, %ymm1, %ymm6
    vpmuludq	%ymm1, %ymm5, %ymm5
    vpmuludq	%ymm6, %ymm3, %ymm6
    vpmuludq	%ymm1, %ymm3, %ymm1
    vpsrlq	$32, %ymm4, %ymm3
    vpmuludq	%ymm2, %ymm3, %ymm3
    vpaddq	%ymm5, %ymm6, %ymm5
    vpsllq	$32, %ymm5, %ymm5
    vpaddq	%ymm5, %ymm1, %ymm1
    vpsrlq	$32, %ymm2, %ymm5
    vpmuludq	%ymm2, %ymm4, %ymm2
    vpaddq	(%r14,%rax,8), %ymm1, %ymm1
    vpmuludq	%ymm5, %ymm4, %ymm5
    vpaddq	%ymm3, %ymm5, %ymm3
    vpsllq	$32, %ymm3, %ymm3
    vpaddq	%ymm3, %ymm2, %ymm2
    vpaddq	32(%r14,%rax,8), %ymm2, %ymm2
    vpaddq	%ymm0, %ymm1, %ymm1 /// in ymm0 there is constant 5. vpbroadcastq	(%rbp), %ymm0
    vmovdqu	%ymm1, (%r10,%rax,8)
    vpaddq	%ymm0, %ymm2, %ymm2
    vmovdqu	%ymm2, 32(%r10,%rax,8)
    addq	$8, %rax
    cmpq	%rax, %r8
ClickHouse distributed as portable binary.
We use the old instruction set SSE4.2.
For AVX, AVX2, AVX512 instructions need to use runtime instructions specialization using CPUID.
In addition a lot of companies bring us SIMD optimizations (ContentSquare, Intel), before most such optimizations were disabled during compilation time.
It is important that compilers can vectorize even complex loops. We can rely on this.
Main idea apply compiler flags to some functions, to compile it with AVX, AVX2, AVX512
Then in runtime check CPUID and execute specialized function.
For example for clang:
#   define BEGIN_AVX512F_SPECIFIC_CODE \
_Pragma("clang attribute push(__attribute__((target(\"sse,sse2,sse3,ssse3,sse4,\
    popcnt,avx,avx2, avx512f\"))), apply_to=function)")
\
#   define BEGIN_AVX2_SPECIFIC_CODE \
_Pragma("clang attribute push(__attribute__((target(\"sse,sse2,sse3,ssse3,sse4,\
    popcnt, avx,avx2\"))), apply_to=function)") \
\
#   define END_TARGET_SPECIFIC_CODE \
_Pragma("clang attribute pop")
Usage for standalone functions:
DECLARE_DEFAULT_CODE (
    int funcImpl() {
        return 1;
    }
) // DECLARE_DEFAULT_CODE

DECLARE_AVX2_SPECIFIC_CODE (
    int funcImpl() {
        return 2;
    }
) // DECLARE_DEFAULT_CODE

/// Dispatcher function
int dispatchFunc() {
#if USE_MULTITARGET_CODE
    if (isArchSupported(TargetArch::AVX2))
        return TargetSpecific::AVX2::funcImpl();
#endif
    return TargetSpecific::Default::funcImpl();
}
Standalone functions are not interesting.
#define AVX512_FUNCTION_SPECIFIC_ATTRIBUTE __attribute__((target("sse,sse2,sse3,\
            ssse3,sse4,popcnt, avx,avx2,avx512f"))) \
\
#define AVX2_FUNCTION_SPECIFIC_ATTRIBUTE __attribute__((target("sse,sse2,sse3,ssse3,\
    sse4,popcnt, avx,avx2"))) \
Insert specific attribute before function name.
We also need to generate functions with different names. Ideally with suffixes like SSE42, AVX2, AVX512.
int /*Insert specific attribute here*/ testFunctionImpl(int value)
{
    return value;
}

int AVX2_FUNCTION_SPECIFIC_ATTRIBUTE testFunctionImplAVX2(int value)
{
    return value;
}
Split function into header (MULTITARGET_FUNCTION_HEADER), name and body (MULTITARGET_FUNCTION_BODY) to insert specific attribute before name.
MULTITARGET_FUNCTION_AVX2_SSE42(
MULTITARGET_FUNCTION_HEADER(int),
/*We need to insert specific attribute here*/ testFunctionImpl,
MULTITARGET_FUNCTION_BODY((int value)
{
    return value;
}))
Our infrastructure is ready.
Now how to find places where SIMD optimizations can be applied?
Make build in our performance tests for AVX, AVX2, AVX512.
If some performance tests will run much faster, we find place for dynamic dispatch.
Wrap such place into our macros.
Find a place using our performance tests.
template <typename Value>
void NO_INLINE addManyImpl(const Value * __restrict ptr, size_t start, size_t end)
{
    ptr += start;
    size_t count = end - start;
    const auto * end_ptr = ptr + count;

    /// Loop
    T local_sum{};
    while (ptr < end_ptr)
    {
        Impl::add(local_sum, *ptr);
        ++ptr;
    }
    Impl::add(sum, local_sum);
}
Wrap function in our dynamic dispatch macro.
MULTITARGET_FUNCTION_AVX2_SSE42(
MULTITARGET_FUNCTION_HEADER(
template <typename Value>
void NO_SANITIZE_UNDEFINED NO_INLINE
), addManyImpl,
MULTITARGET_FUNCTION_BODY((const Value * __restrict ptr, size_t start, size_t end)
{
    ptr += start;
    size_t count = end - start;
    const auto * end_ptr = ptr + count;

    /// Loop
    T local_sum{};
    while (ptr < end_ptr)
    {
        Impl::add(local_sum, *ptr);
        ++ptr;
    }
    Impl::add(sum, local_sum);
}))
Dispatch function based on CPUID:
template <typename Value>
void NO_INLINE addMany(const Value * __restrict ptr, size_t start, size_t end)
{
    #if USE_MULTITARGET_CODE
    if (isArchSupported(TargetArch::AVX2))
    {
        addManyImplAVX2(ptr, start, end);
        return;
    }
    else if (isArchSupported(TargetArch::SSE42))
    {
        addManyImplSSE42(ptr, start, end);
        return;
    }
    #endif

    addManyImpl(ptr, start, end);
}
Loop in unary functions.
static void vector(const ArrayA & a, ArrayC & c)
{
    /// Loop Op::apply is template for operation
    size_t size = a.size();
    for (size_t i = 0; i < size; ++i)
        c[i] = Op::apply(a[i]);
}
Loop in unary functions.
MULTITARGET_FUNCTION_WRAPPER_AVX2_SSE42(
MULTITARGET_FH(static void NO_INLINE),
vectorImpl,
MULTITARGET_FB((const ArrayA & a, ArrayC & c) /// NOLINT
{
    /// Loop Op::apply is template for operation
    size_t size = a.size();
    for (size_t i = 0; i < size; ++i)
        c[i] = Op::apply(a[i]);
}))
roundDuration optimized even better than others using special AVX2 instructions.
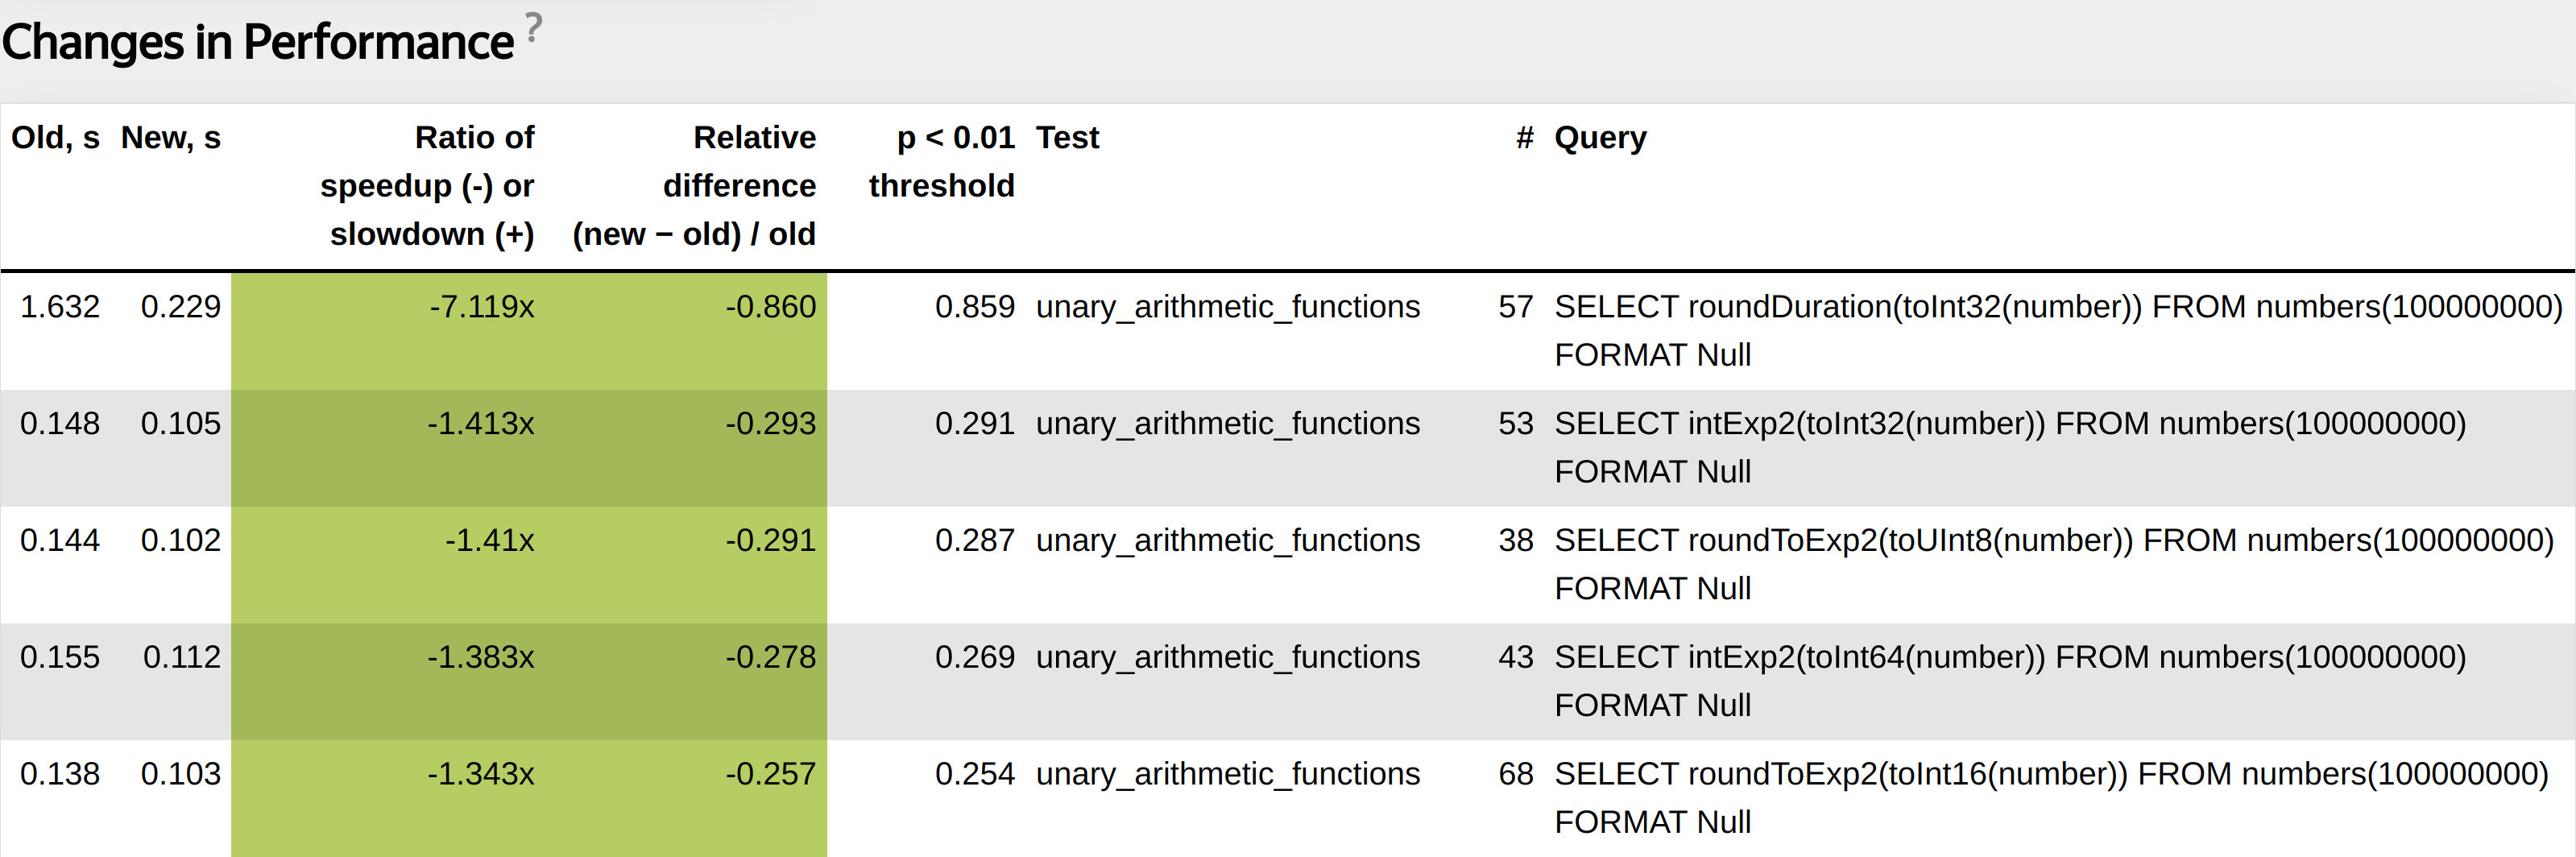
For AVX2 we use such optimizations a lot.
For AVX512 currently we do not apply a lot of such optimizations. It potentially could decrease performance of other system parts.
Latest Intel processors like Rocket Lake and Ice Lake fix this issue. We can detect such processors in runtime and then use optimizations.
https://stackoverflow.com/questions/56852812/simd-instructions-lowering-cpu-frequency
We have AVX, AVX2, AVX512 pull requests that periodically build ClickHouse to check if there are some places to improve.
https://github.com/ClickHouse/ClickHouse/pull/34071
1. CI/CD infrastructure, especially performance tests, must be the core component of a high performance system.
2. Without deep introspection it is hard to investigate issues with performance.
3. For high performance systems interfaces must be determined by algorithms.
4. Add specializations for special cases.
5. Tune your performance using low-level techniques (Data layout, JIT compilation, Dynamic Dispatch).